

Seed Oils & Body Fat: When did Obesity Start Rising?
Obesity started rising sooner than many realize. Seed oils correlate with obesity rates better than saturated fat or carbs.

Not medical advice.
M&M written content is human-generated, independently researched, and filled with links to resources to deepen your learning. Click here to see all the ways you can support my work.

This post is one of several exploring the relationship between dietary ω-6 polyunsaturated fats like linoleic acid (the primary fat in seed oils) and body fat: obesity, fatty liver disease, and adiposity generally. Each post explores one or more of the Overall Points listed below. Links to related content and resources throughout.
Next Article | Seed Oils & Body Fat: ω-6 PUFAs cause obesity & fatty liver
Overall Points:
Seed oil consumption has steadily risen since the 1800s, correlating with rises and falls in obesity better than carbohydrates or saturated fat.
In animals, high linoleic acid diets drive weight gain more than alternative diets, even when alternatives have less saturated fat or more sugar.
In animals, boosting dietary linoleic acid content from ~1% to ~8% of energy is sufficient to drive weight gain, adiposity, and fatty liver. Today, the average American gets >10% of calories from linoleic acid.
Animals genetically engineered to convert ω-6 PUFAs into ω-3 PUFAs are resistant to obesity and other forms of metabolic dysfunction.
The obesogenic effects of seed oils are tied to the endocannabinoid system, which is functionally conserved across species (including humans).
In Nature, seasonal changes that result in more PUFA consumption drive weight gain and metabolic shifts that prepare animals for food scarcity and hibernation.
The evolutionary purpose of this biology is serve to promote energy intake and storage in times of plenty, resulting in survival during future periods of scarcity.
Large RCTs with proper tissue measurements and dietary control are lacking. Such trials would need to last for several years to detect the obesogenic effects observed in preclinical studies.
Observational human studies that carefully measure tissue levels of ω-6 and ω-3 PUFAs over time are rare. Those that exist show a positive association between obesity and ω-6 PUFAs.
Weight loss drugs past and present work downstream of ω-6 PUFAs, along the pathway linking them to endocannabinoid regulation of reward, whole-body metabolism, and feeding behavior.
When Did People Begin Getting Fatter?
When did Americans start getting fatter, as a population?
Many point the mid-to-late 20th century as the time when the “obesity epidemic” started. Obesity did get worse, faster, at various times in this period. But obesity was already well above historical averages.
Some point to ~1970, when multiple factors may have conspired to begin making people more unhealthy: novel fake foods were mass marketed and distributed more than ever. New synthetic chemicals were being liberally used, all over. The US went off the gold standard, ushering in the present era of fiat currency—dollars untethered from physical reality, enabling the cheapification of everything via money printing. That is indeed an important story to tell—but again, people had already started getting fatter.

To understand the origins and driving forces that underlie any pattern of change, we need to measure that change relative to some stable baseline. What is the stable baseline for obesity? When did people, at the population level, clearly start to get more obese relative to an extended period where obesity rates were stable and low?
Another reason to look into the period in which obesity initially started rising: the world gets less complex as we go back in time. From the dawn of the industrial age through the present, there’s been more and more stuff. More people. More “foods.” More chemicals. More gadgets, etc., etc. But before most of this stuff was invented, marketed, and consumed, people were already getting fatter. Perhaps not as quickly, but still…
If we go back to the origins of this pattern, we will have fewer variables to consider. Moving forward from that starting point, more and more elements of industrial modernity helped accelerate the physical (and therefore psychological) deterioration of our species. All of that is important… and complicated. When you have a large, unknown, and growing number of interacting variables to disentangle, clear answers become more difficult to pinpoint.
Let’s start our journey in roughly the present-day, and work backwards through a series of charts commonly referred to in discussions about obesity and metabolic health. Our first lesson will be that where one chooses to truncate a time series can strongly influence the story that gets told about where it comes from. Again: we want to look at as much data over time as possible, making sure we have a stable baseline to compare to. If our analysis doesn’t actually begin at the beginning, then we’re more likely to concoct a just-so story.

Our journey backwards in time will take us to the 1800s, focusing on the major macronutrients that most consistently correlate with the rise in obesity over time, from beginning, to middle, to present.
Important: there are other drivers of obesity, beyond macronutrients: artificial light, from the invention of light bulbs to the blue light LEDs of today; synthetic chemical obesogens and endocrine disruptors; pharmaceutical drugs, handed out like candy. All of these are important factors in metabolic dysfunction and technology-driven changes in our behavior patterns.
My purpose in this post is to focus on which specific macronutritional factors have the clearest and longest relationship with obesity. My current view is that industrial seed oils are the biggest culprit, more so than sugar or other types of fat.
I am not saying that seed oils are the sole explanation for obesity or metabolic dysfunction generally, especially in the present-day. Artificial light and synthetic chemical obesogens play a major role in modern metabolic decay. To learn on those fronts, check out these M&M episodes:
Learn more about the harmful effects of artificial light:
M&M 146 | Photobiology, Sunlight, Firelight, Incandescent Bulbs vs. LEDs, Mitochondria, Melatonin, Sunscreen & the Optics of the Body | Scott Zimmerman
M&M 221 | Regenerative Energy & the Light Inside You | Jack Kruse
Learn more about chemical obesogens and endocrine disruptors:
M&M 145 | Epigenetics, Hormones, Endocrine Disruptors, Microplastics, Xenoestrogens, Obesogens & Obesity, Inheritance of Acquired Characteristics | Bruce Blumberg
M&M 184 | Endocrine Disruptors & Metabolism: Microplastics, BPA, Estrogen, Insulin, Pancreas Biology & Metabolic Dysfunction | Angel Nadal
I am also not saying that other macronutrients, or overall calorie intake, aren’t factors in obesity. We will touch on how fructose fits into the mix, and why I think combination of high PUFA + high fructose is especially bad. But as we will see, seed oils have perhaps the longest and clearest association with human obesity at the population level, and are causally linked to obesity and fatty liver.
An interesting observation, from a social psychology perspective: for some reason, PUFAs are not popularly associated with obesogenic effects. This appears to be true in the minds of regular people and the general influencer-driven online zeitgeist, where you’re much more likely to hear people blame obesity on things like added sugars and high-carb intake. Even among experts, there appears to be low awareness of the literature on the obesogenic effects of seed oils. Ponder that, as you read this.
And once again, I’m not saying these other things don’t fit into the picture.
Learn more about how I think about carbohydrates and carb:fat ratios impact obesity:
Article | Dietary Fructose & Metabolic Health: An Evolutionary Perspective
Article | Carbohydrate:Fat Ratios in Fat Gain & Obesity
I’m going to paint a picture that ω-6 PUFAs (seed oils) are obesogenic on their own, and have probably been important in driving obesity rates up (and down) across the globe—in recent history, and from the true early days of obesity’s rise.
At the same time, the effects of high ω-6 PUFA intake are made even worse in the presence of other things, such as certain light and food combinations. High fat intake with high ω-6 PUFA load, paired with high carb intake, is more obesogenic than high intake of overall carbs or fat. Pairing high ω-6 PUFA intake together with high levels of fructose, within the context of a high-fat + high-carb diet, is really bad. And guess what? That’s basically the “Western-style” diet. It’s not just high fat or high carb. It is high-fat and high-carb, with a very high ω-6 PUFA load and high levels of fructose.
The light environment also interacts with the fat profile of animals’ diet. Under natural conditions, these things change seasonally correlate systematically. Animals likely evolved to use these correlated environmental signals to anticipate seasonal changes and shift metabolism accordingly, e.g. to fatten up in preparation for the long nights and relative food scarcity of winter.
In another post, I‘ll share evidence that the new GLP-1 weight loss drugs everyone is raving about are probably acting on brain pathways that link ω-6 PUFAs to feeding and reward processing via the endocannabinoid system—the same pathway that links dietary ω-6 PUFAs to biological shifts that promote energy storage, which evolved to keep animals alive in the likely event of future food scarcity. Feast now, to survive famine later. Today, that famine never arrives.
Let’s begin by looking at population-level data on obesity over time, starting the near present-day, marching backwards. When did Americans start getting fatter?
Learn more about how endocannabinoid biology affects metabolism and feeding behavior:
Article | Metabolic Effects of Cannabinoids
Podcast | Cannabinoid System: Metabolism, Evolution & Energy Storage | Giovanni Marsicano
Backwards Down the Number Line
This is an informative, recent-ish graph. It indicates that, at the population level, obesity has continued rising since the year 2000, despite flat available energy and calorie intake.

More recent data indicates that 2020 may have been peak American obesity. The wildly popular GLP-1 weight loss drugs appear to be having a noticeable effect obesity rates, and I will link this to PUFA biology near the end. For now, we’re interested here in what was going on when obesity rates originally started to rise, which was clearly before the 2000s.

If push back the time axis to 1980, we see that obesity rates were… still already climbing:

Going back even further, we observe something seems to have happened around 1980. The US Dietary Guidelines for Americans began getting release every few years in the 1980s, crafted by “experts” and uploaded to young minds via the education system. The infamous Food Pyramid and low-fat craze spawned from this. But again, we’re interested in when people started getting fat, not when they started getting even fatter, faster.
Notice that although the line is more shallow before 1980, it was still already rising.

Sometimes people point to the post-WWII era, roughly the mid-1940s to 1960. During this period, photographs seem to show a much leaner population.

Another trend you see in this period: we got really good at farming. Grain yields exploded, generating huge surpluses of corn, soybeans, etc.

From these surpluses, cheap grain-based goods were mass produced—a major driving force behind the move away from animal-based fats and oils, toward plant-based ones. This more or less means less animal fats, more seed oils.
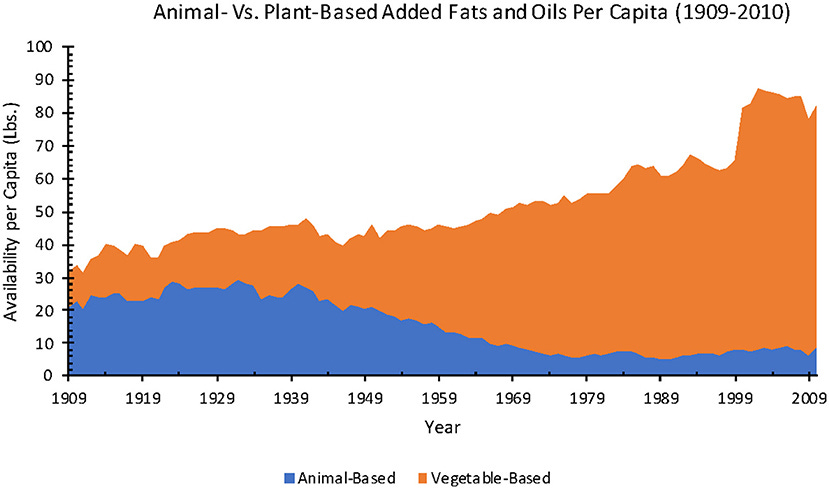
Again, notice that before the 1950s, plant-based fats and oils were already on the rise. And did Americans actually start getting fatter after WWII, in the mid-20th century? Or had that trend already begun, just at a slower rate? Is it possible that Americans had begun getting fatter well before the post-WWII boom and subsequent accelerations in obesity?
In M&M 136, Dr. Chris Knobbe discussed the work of Dr. Weston Price, whose research in the 1930s already indicated that people consuming industrial foods around the world were already malnourished compared to those still eating traditional diets. In particular, he noted deficiencies in fat soluble vitamins and other nutrients, tying those deficiencies to chronic diseases already on the rise back then. (Images from and commentary on Price’s masterpiece book in this article).
I asked Dr. Knobbe a simple question: If Price was publishing these observations in the 1930s, and malnutrition and chronic diseases were already on the rise, why didn’t the obesity epidemic start by the 1930s?
His response:
I think it did.
There [isn’t much hard data on that], but it was increasing. Again, processed food consumption was far lower in the 1930s [than it was later on, or today]. But the main thing that was relatively low in the 1930s was vegetable oils—the seed oils.
And but if you look at the data, beginning in the 19th century, regarding overweight/obesity—Scott Alan Carson’s work on prisoners, men aged 18 to 80—in the 19th century, their obesity was 1.2%. So if we just use the year 1900 as a starting point, well the next actual data is 1960. And in 1960, our obesity in the United States was 13%.
So we went from 1.2%, in 1900, to 13% by 1960. So, 1960 is when most researchers think we didn’t have a problem. But clearly, the problem was already there, it was just expanding. And then others will say, ‘Well, you know, the problem began with the, the US government’s recommendation to go low fat and 1980.’
And that’s when it exploded, because it did. In 1980, obesity was about 14%. And then by 2018, 42.5% obesity.
So, obesity rates were above 10% by 1960, when we started collecting reasonably good population-level data. Before that, the data are sparse. So we can say that the “obesity epidemic” had certainly begun before 1960, although pinpointing exactly when is tricky.
He referenced this work, which used prison records of male inmates across the US to map rates of overweight/obesity in the late 1800s Those records show an overweight and obesity rate among inmates of 21.5% and 1.2%, respectively, with little change in BMI values between 1876 and 1919.
If we take that as a “stable baseline,” then obesity rates in the US must have started clearly rising sometime around 1900 or later, well before 1960. In the early 1900s, industrialization was in full swing, but the US was relatively less complex. The population was smaller and less diverse. Processed foods were coming onto the scene, but there were far fewer of them. Microplastics, LEDs, and a host of other things came later.
So, in this relatively less complex environment, what did the macronutritional landscape look like, and how was it changing prior to about 1940?
Nick Jikomes: A lot of people treat the 1960s, the mid-20th century, as the baseline. And you can treat it as the baseline if you want. But what you’re saying is, 13% should have been considered a very high obesity rate [the approximate rate in the 1960s] compared to the deeper history that we have.
Chris Knobbe: Yeah, you don’t want to use 1960 or 1980 as a baseline. That would be ridiculous. Because we already had a huge amount of processed foods in the food supply by that point. And obviously, that’s what the people were eating.
So with any hypothesis you want to proffer, regarding any condition or disease, you want to go back to a time when that disease was extremely rare or didn’t exist, and then see what changed. And that’s why you need to go clear back into the 19th century as far as you can go. And look at these food consumption patterns in relation to obesity and all the chronic diseases.
The seed oils were really introduced in the United States right after the American Civil War, about 1866.
And in 1900, they were still only about one gram a day.
1909, nine grams a day.
1960, nineteen grams a day.
2010, eighty grams per person per day.
NJ: Eighty?
CK: Eighty!
So, eighty grams of fat is 720 calories, it’s nine calories per gram. So that works out to be about 32% of US caloric intake.
You’re looking at about a fourth to possibly a third of the American diet is made up of [seed] oils. And those did not exist for almost all of history until after the American Civil War.
Seed oils were introduced into the US food supply in the form of cottonseed oil in the 1860s. I’m not sure how widely consumed it was, but intake would have been modest compared to later “vegetable oils” (seed oils). Procter & Gamble developed and started marketing Crisco in the 1910s, helping drive the pattern seen in the first chunk of this graph:
The latter part of the graph, when “vegetable-based” oils began to really take off, is related to the explosion in grain yields in the mid-1900s we saw above. In other words, seed oil consumption started in the 1800s with cottonseed oil. Consumption rates increased after the introduction of Crisco in the 1910s. After WWII, the country was really booming: mass marketing and adoption of seed oils really took off.
How does seed oils consumption correlate with obesity?
But wait, weren’t Americans increasing their sugar intake this whole time, too?
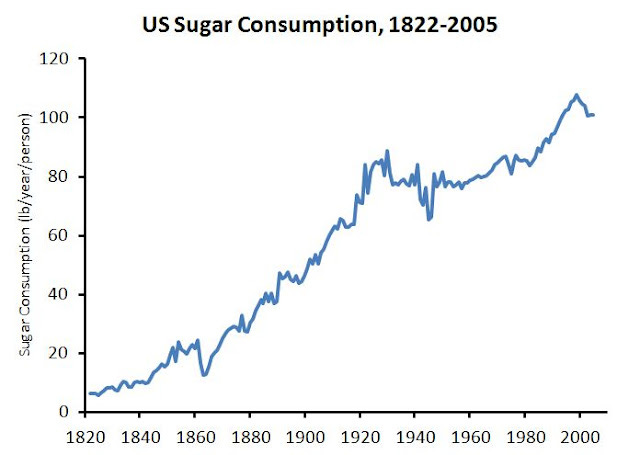
As discussed in more detail here, a major and usually overlooked caveat is that these charts do not actually capture consumption per se, despite how they’re labelled. They are usually plots of supply, which we take as a proxy for consumption. Caveats aside, note three salient features of sugar supply over time:
In general, it has gone up over time—by a lot, overall. Early 1900s were way higher than early 1800s. Early 2000s were significantly higher still.
From roughly 1930 to 1960, “consumption” was more or less flat. But obesity kept increasing over this period.
Sugar peaked about year 2000, then declined noticeably, although to levels that are still way, way higher than for most of recorded history.
How does this compare to total fat, as well as the “intake” of specific fats, like saturated fat and PUFAs? Recall that saturated fat has been considered the major boogeyman by the mainstream. It should correlate best with obesity and chronic disease, right?
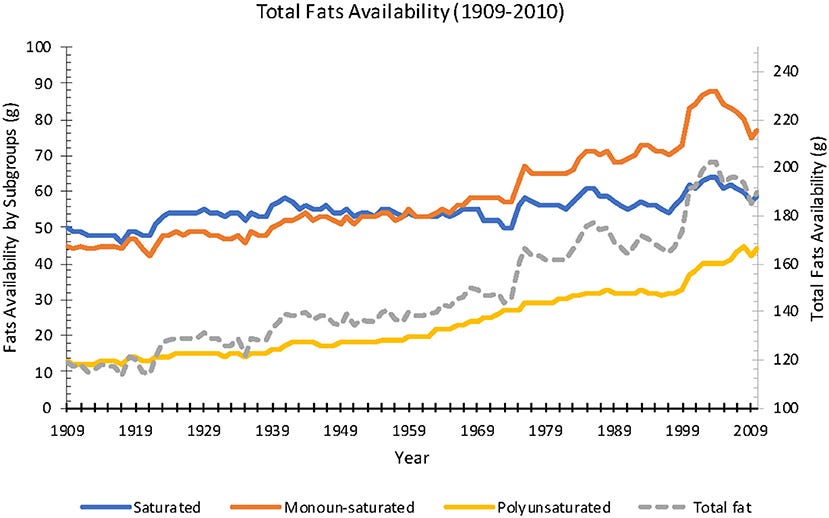
Seed oil consumption has more or less never declined ever since these industrial oils were introduced into the food supply. In fact, seed oils consumption is why intake of polyunsaturated fatty acids (PUFAs; the primary type of fatty acid in seed oils) has increased steadily since 1900, unlike other macronutrients or caloric intake generally. In fact, around the year 2000, saturated fat, monounsaturated fat, and total calorie availability declined in the US, while PUFA intake accelerated.
As was saw above, sugar availability also declined in recent history. The chart below was included in this article, which critiques the viewpoint that the decline in sugar since 2000 means we can rule out any role of sugar intake in obesity. Nonetheless, the divergence between sugar and PUFAs since 2000 is striking and does, I believe, point us to some important underlying biology.
Learn more about the importance of macronutrient ratios in metabolic health, and consumption of different nutrients has changed over time:
Article | Carbohydrate:Fat Ratios in Fat Gain & Obesity
Article | Sugar Has No Impact On Obesity: Just-so stories in metabolic health
We face a statistical problem when trying to parse all the variables. From the late 1800s to the present, total calorie intake generally rose. Fat intake, too. And sugar. And so on. Despite some fluctuations and divergences between these factors, like those seen since the year 2000, these things are generally correlated over time. This makes it difficult to decipher meaningful correlations (which point us toward potential causation) from coincidental ones (which simply distract us). Nonetheless, among the major food types, seed oils (“vegetable oils”) positively correlate with obesity rates better than others, such as sugars and saturated fat.
The charts above are US data. This one is composed of data from seventeen countries, representing about half the global population (from a talk by Dr. Knobbe):
What would be more compelling is if we had examples of times and places where obesity rates declined, after having risen. If any single macronutritional variable is a clear, strong driver of obesity, it should rise when obesity rates rise, and fall (or at least slow down) if and when obesity rates decline.
Are there any such examples?
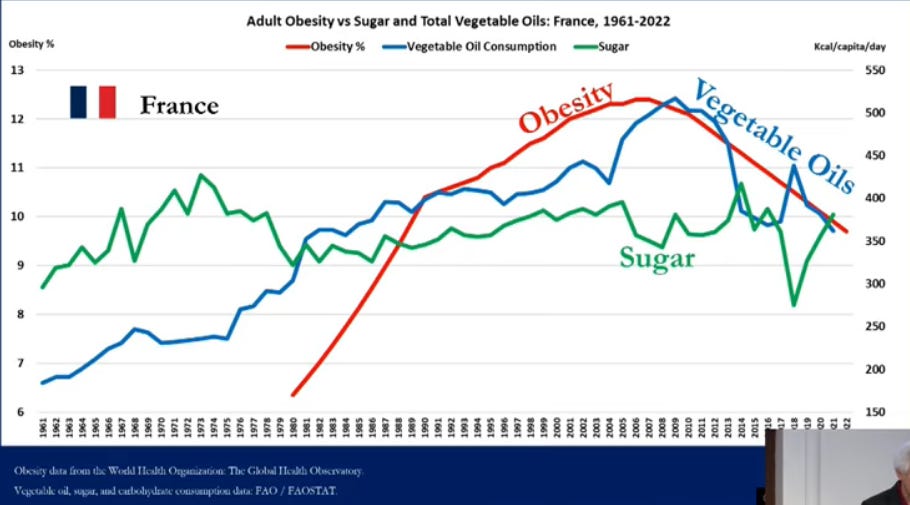
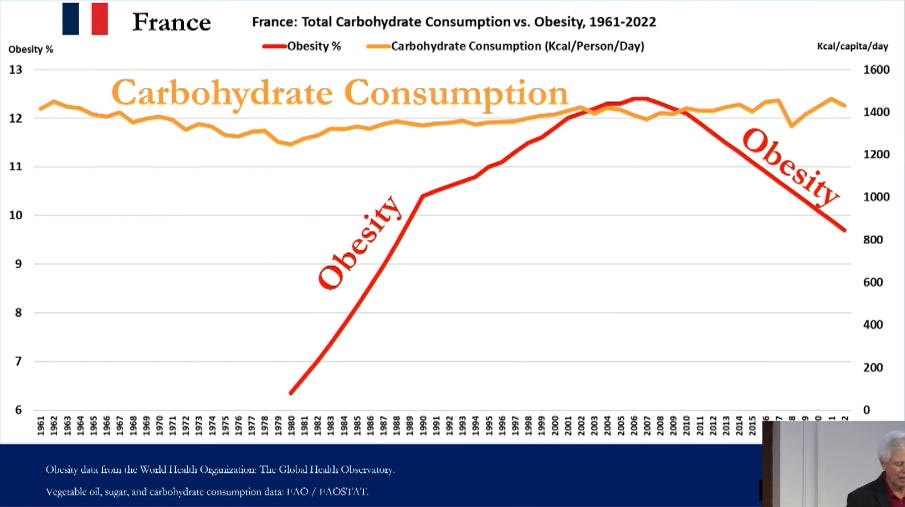
Dr. Knobbe has pointed out the interesting case of France, which is apparently the only known country where obesity and diabetes rates have declined over an approximately ten-year period since the 2000s.
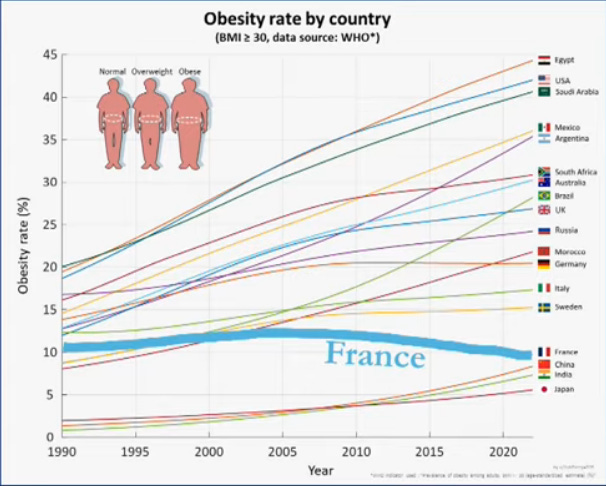
Knobbe spent a year compiling food supply data in France, finding that the declines in obesity and diabetes co-occurred with declines in seed oil consumption, but did not correlate with sugar or carbohydrate intake.
Consider also the “Israeli Paradox”: Israeli Jews consume a diet that appears “healthy” by mainstream institutional standards—low in saturated fats, cholesterol, and total calories, while high in polyunsaturated fats (PUFAs), fruits, vegetables, and whole grains—yet they experience rates of coronary heart disease (CHD), obesity, type 2 diabetes, hypertension, and cancer similar to those in Western countries like the United States.
This “paradox” is only a paradox within the mainstream medical paradigm that insists that PUFAs are “heart healthy,” and saturated fat and cholesterol drive heart disease. Once you educate yourself on the fundamentals of lipid metabolism, you will know that PUFAs are subject to lipid peroxidation, which generates oxidative stress and causes cellular dysfunction. The “Israeli Paradox” is not a paradox at all—it’s what you expect from high PUFA intake, and also fits with the pattern in France.
At the end of the day, however, these things are just associations. In M&M 136, Dr. Knobbe made the case that seed oils are in fact obesogenic, and that these patterns are not mere correlations.
Is that true? Are PUFAs, especially ω-6 PUFAs like linoleic acid truly obesogenic? Do they causally drive fat and weight gain? Are they more obesogenic in animals than other diets, such as those high in sugar?
In another post, we’ll examine evidence showing that high linoleic acid (seed oil) diets cause obesity and fatty liver. We will then contextualize those findings within a broader theoretical framework to understand why things evolved this way.
Other articles related to this one:
Seed Oils & Body Fat: ω-6 PUFAs cause obesity & fatty liver
Seed Oils & Body Fat: Endocannabinoid Regulation of Food Intake & Energy Storage
I wonder if just growing corn as a major staple crop led America on a path to more obesity. In one study, merely feeding the animals corn as a carb baseline made them obese because corn is too high in LA already (vs. molasses and some other carb baselines).
Amazing post, would love to see a podcast with Jaromír Janda from MCT4health and one with Peter Dobromylskyj from hyperlipid!