


Genetic Variation in Fat Metabolism: Seed Oils, Evolution & Pitfalls in Clinical Studies
Humans display genetic diversity in fat metabolism, reflecting the evolutionary history of our species. This has consequences for the effects of seed oils and interpretation of clinical trials.

Not medical advice.

Something health gurus routinely say about seed oils: “Well, the clinical evidence is mixed.”
Is the evidence mixed? Or are you assuming that every RCT that’s published is well-conducted, measures the appropriate factors, and that all people should respond to a given dietary intervention the same way?
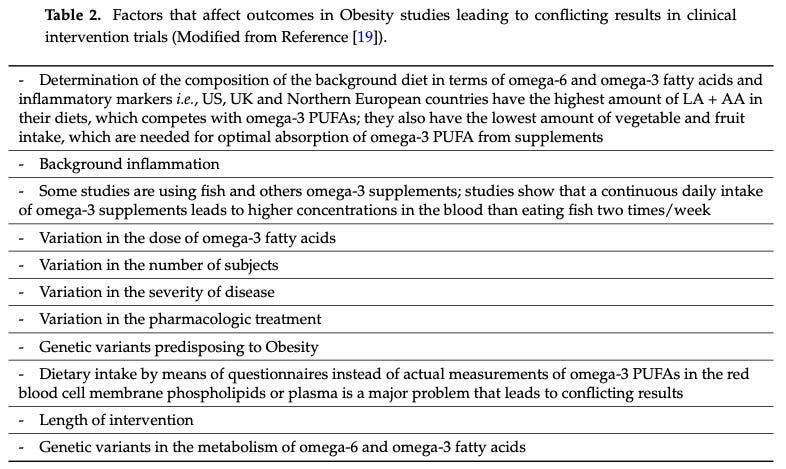
As I’ve discussed here, most human clinical trials looking at the effects of dietary polyunsaturated fatty acids (PUFAs are not properly designed, usually lacking critical controls and measurements, such as these:
Many people, including scientists and clinical researchers, operate under the tacit assumption that all human beings are more or less biologically equivalent, with differences mostly confined to surface-level traits. In reality, humans are just like every other species: we display variation, with different lineages exhibiting distinct patterns of phenotypic variation. Human metabolism is highly variable among people. There is clear genomic evidence that natural selection has favored metabolic shifts in various directions as humans spread across the Earth, reflecting adaptations to different natural food environments.
Important elements of metabolic diversity evolved very recently, since the Agricultural Revolution. This variation is beautiful, fascinating, and consequential for human health and wellness. It’s also being ignored by most so-called health experts and influencers, especially those trying to sell one-size-fits all nutrient potions. They want to sell everyone the same metabolic solution, a goal which is justified under the belief that humans are biologically fungible units that will all benefit equally from their elixir.
If you observe Nature independent of human wants, diversity and change are the name of the game. Populations always display some level of individual diversity, often substantially so (especially in sexually reproducing species). The forces of mass appeal are inherently attracted to the idea of population homogeneity, which is why so many elements of modern society are biased toward homogenizing us. If everyone is the same, you can sell them all the same stuff, the same way. One marketing strategy to rule them all.
Anyways, if you have the courage to stare the cold, hard realities of Nature in the face, what you’re going to see is variation and diversity. PUFA metabolism is one area of human biology with lots of individual diversity. If you randomly select two humans from Earth and compare them, there’s a good shot they will display intrinsic differences in nutrient metabolism. How they differ determines the ways in which a given diet is likely to affect them, including how they respond in a clinical trial. Why they differ depends on the details of the historical saga of their ancestry, and how it compares to yours.
Before you can understand human variation in PUFA metabolism, you need to know the basics of PUFA metabolism. How are PUFAs metabolized by the human body, and which elements have been subject to evolutionary change and diversification as humans populated the globe?
If you’re already familiar with the basics of PUFA metabolism, feel free to skip ahead. To brush up on fat metabolism and dietary macronutrients, try these articles first:
Dietary PUFA Metabolism
The dietary fats we consume can be used and transformed in various ways. As a part of normal fat metabolism, polyunsaturated fats (PUFAs) undergo changes in carbon chain length and degree of saturation. Enzymes called “elongases” can add carbons to a fatty acid, making it longer. Desaturase enzymes can add C-C double bonds, often resulting in a more “bent” molecule. The length and shape of a fatty acid determines what effect it will have on cells, including whether it can be further transformed by other enzymes.
Knowing the basic difference between saturated, monounsaturated, and polyunsaturated fats is great, but it’s a coarse-grained level of understanding. Eventually, you need to start thinking about fatty acids in terms of chain length and degree of saturation, from low to high along both dimensions. Two fat sources might contain a similar level of saturated fat but still differ considerably in fatty acid composition—one might have mostly short- and medium-chain saturated fatty acids, the other long-chain fatty acids. Consider these foods, compared to one another in terms of a few individual saturated fatty acids:

For unsaturated fats, variation in chain length and degree of saturation allows for a large diversity of mono- and polyunsaturated fatty acids. Differences in overall length and number and placement of double-bonds determines their physical-chemical properties. Two PUFAs might be similar or even identical in terms of the atoms they contain, but drive distinct biological effects due to differences in geometry.

Any given dietary PUFA may undergo several steps of processing, including multiple rounds of elongation and desaturation. At any step along the chain of biochemical transformation, a fatty acid might go off and do something, such as bind a receptor or get integrated into membrane structure, before being transformed further or degraded.
Here’s a diagram showing some of the major processing steps that transform the dietary ω-6 and ω-3 PUFAs linoleic and α-linolenic acid, respectively:
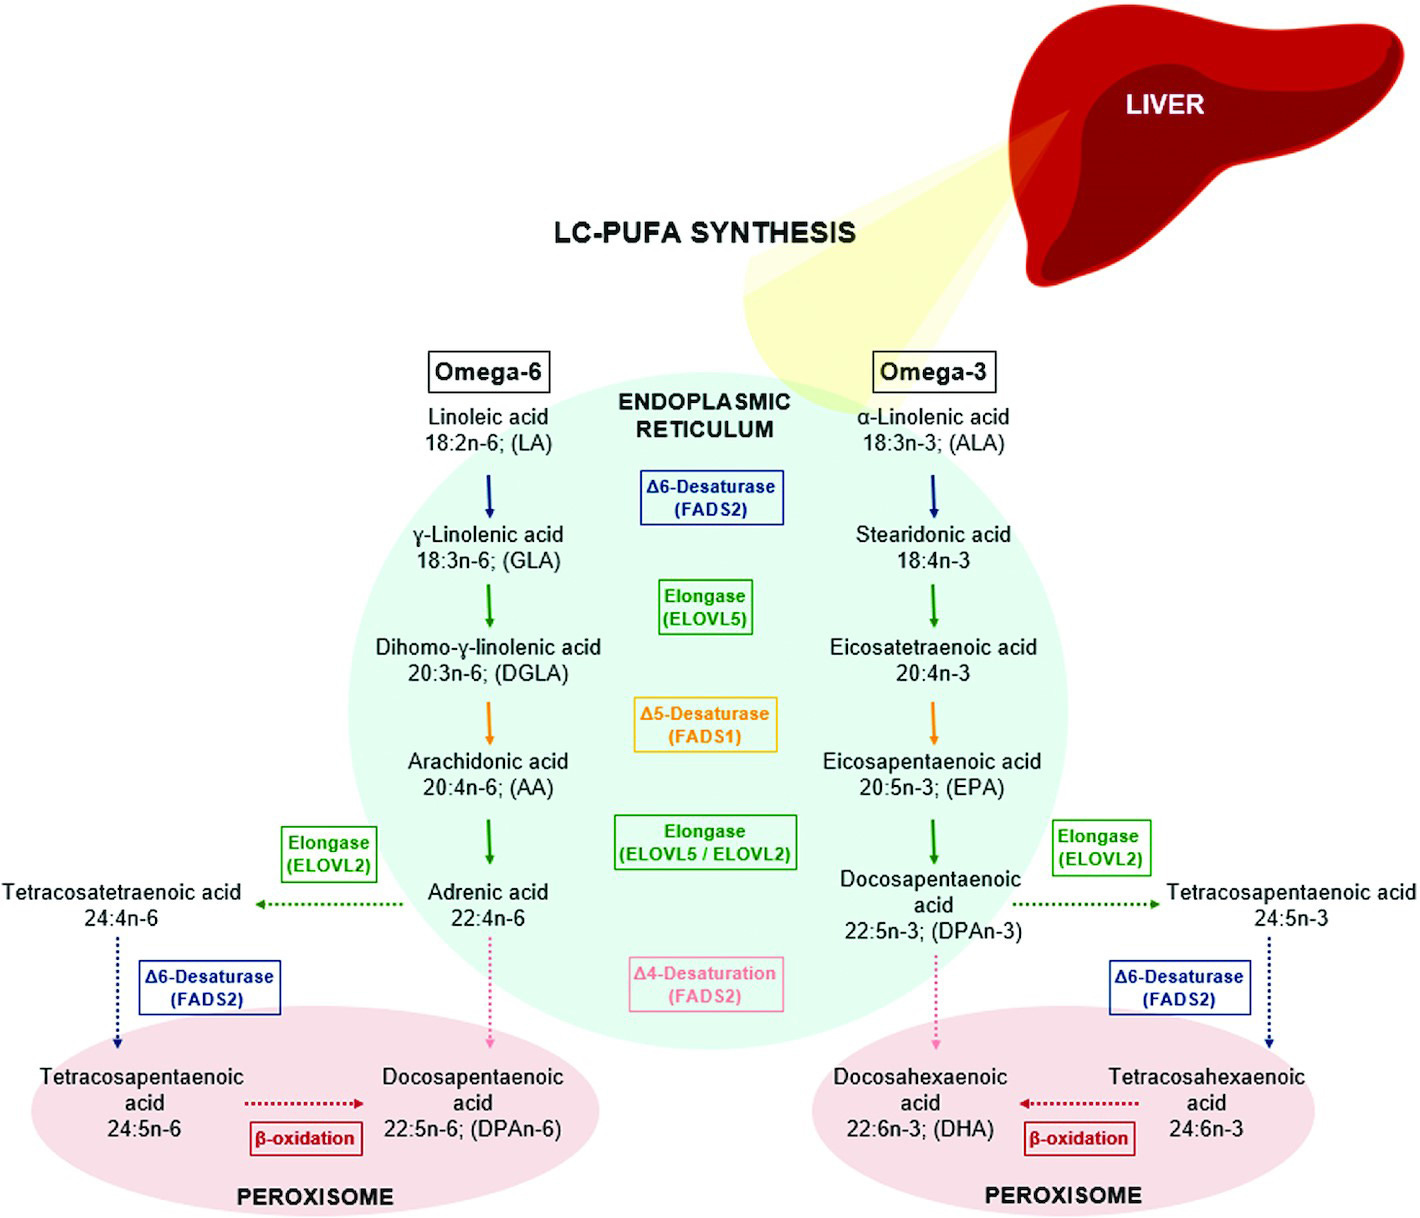
Keep in mind:
These reactions are not guaranteed. At any point, the cell might use an ω-6 or ω-3 PUFA-derived fat molecule for some purpose, preventing it from being transformed into the next molecule depicted in this diagram.
ω-6 and ω-3 PUFAs are processed by the same enzymes, placing them in “competition.” Whenever an elongase or desaturase enzyme is processing an ω-6 PUFA, it cannot at that moment process an ω-3.
ω-6 and ω-3 PUFAs are not interconvertable in humans, so the body cannot naturally balance their ratio by converting ω-6s into ω-3s, or vice versa.
The last two points are major reasons why dietary ω-6:ω-3 balance matters. For example, when ω-6 intake far exceeds ω-3 intake (common today), the ω-3 PUFAs get “boxed out” from enzymatic processing by the overabundant ω-6s, creating imbalances in downstream effector molecules. Because ω-6 and ω-3 PUFAs often have opposing biological effects, this can lead to chronic problems. For example, ω-6 PUFAs are used to make pro-inflammatory lipids, while ω-3 PUFAs are used to make lipid mediators that resolve inflammation.
Learn more about how ω-6:ω-3 PUFA imbalances are related to inflammation and cancer:
M&M 200: Dietary Fats & Seed Oils in Inflammation, Colon Cancer & Chronic Disease | Tim Yeatman & Ganesh Halade
M&M 134: Omega-6-9 Fats, Vegetable & Seed Oils, Sugar, Processed Food, Metabolic Health & Dietary Origins of Chronic Inflammatory Disease | Artemis Simopoulos
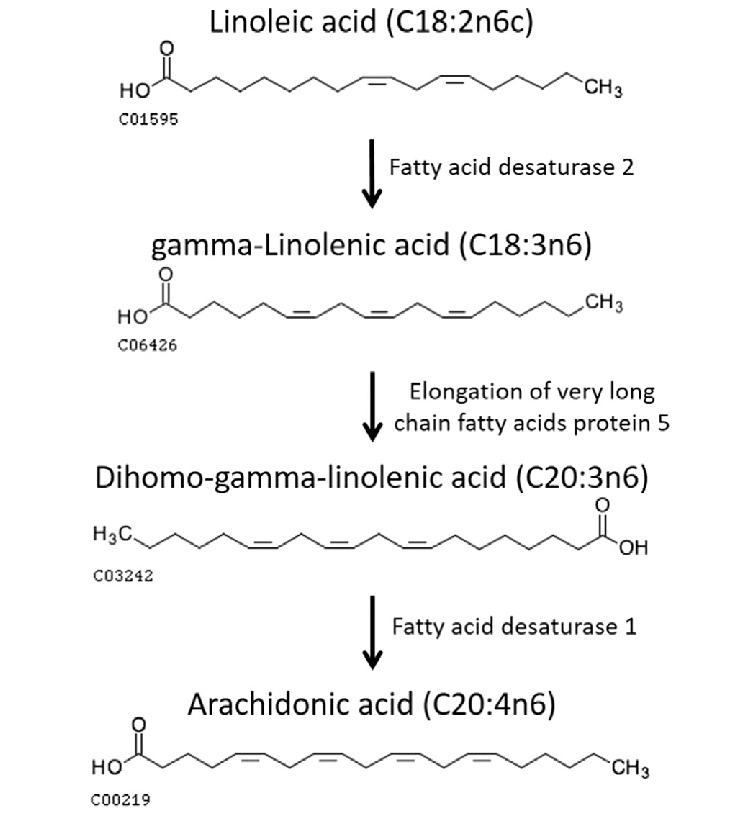
The transformation of linoleic acid into arachidonic acid is a part of metabolism where humans display significant diversity. Notice how the carbon chain-length and number of double-bonds change with each enzymatic step:
From there, arachidonic acid can be transformed in a variety of ways. Below is a depiction of just some of the downstream pathways, resulting in production of eicosanoids, a family of molecules that includes:
Leukotrienes: Involved in inflammatory and allergic responses.
Prostaglandins: Lipid mediators of inflammation. NSAIDs like aspirin work by inhibiting enzymatic production of prostaglandins from arachidonic acid.
Thromboxanes: Important for blood platelet aggregation and clotting. Cancer metastasis seems to involve thromboxanes, which are also inhibited by aspirin.

Things to take away:
Fat metabolism is complex. A lot is going on here. Don’t get lost in the details. Instead, cultivate humility by acknowledging complexity. Neither you nor I will ever fully understand biology. The simple thing to understand: dietary PUFAs can be transformed into other compounds that do stuff.
Cellular regulation. All of these enzymatic steps are regulated. Healthy cells can control how much enzyme they produce, where it gets localized, etc. This stands in contrast to non-enzymatic lipid peroxidation, when PUFAs become inadvertently oxidized by reactive oxygen species, which can trigger an uncontrolled “cellular fire.”
Enzyme diversity. There are many different fatty acid enzymes, each subject to variation between people. As we will see, people vary in how much of FADS enzymes they produce, affecting the conversion rate of dietary plant PUFAs.
Multiple possible fates. Dietary PUFAs have multiple potential fates. The pattern of downstream fates will differ from person to person, on average. For example, linoleic acid might end up transforming into inflammatory prostaglandins, hunger-promoting endocannabinoids, or other effector molecules.
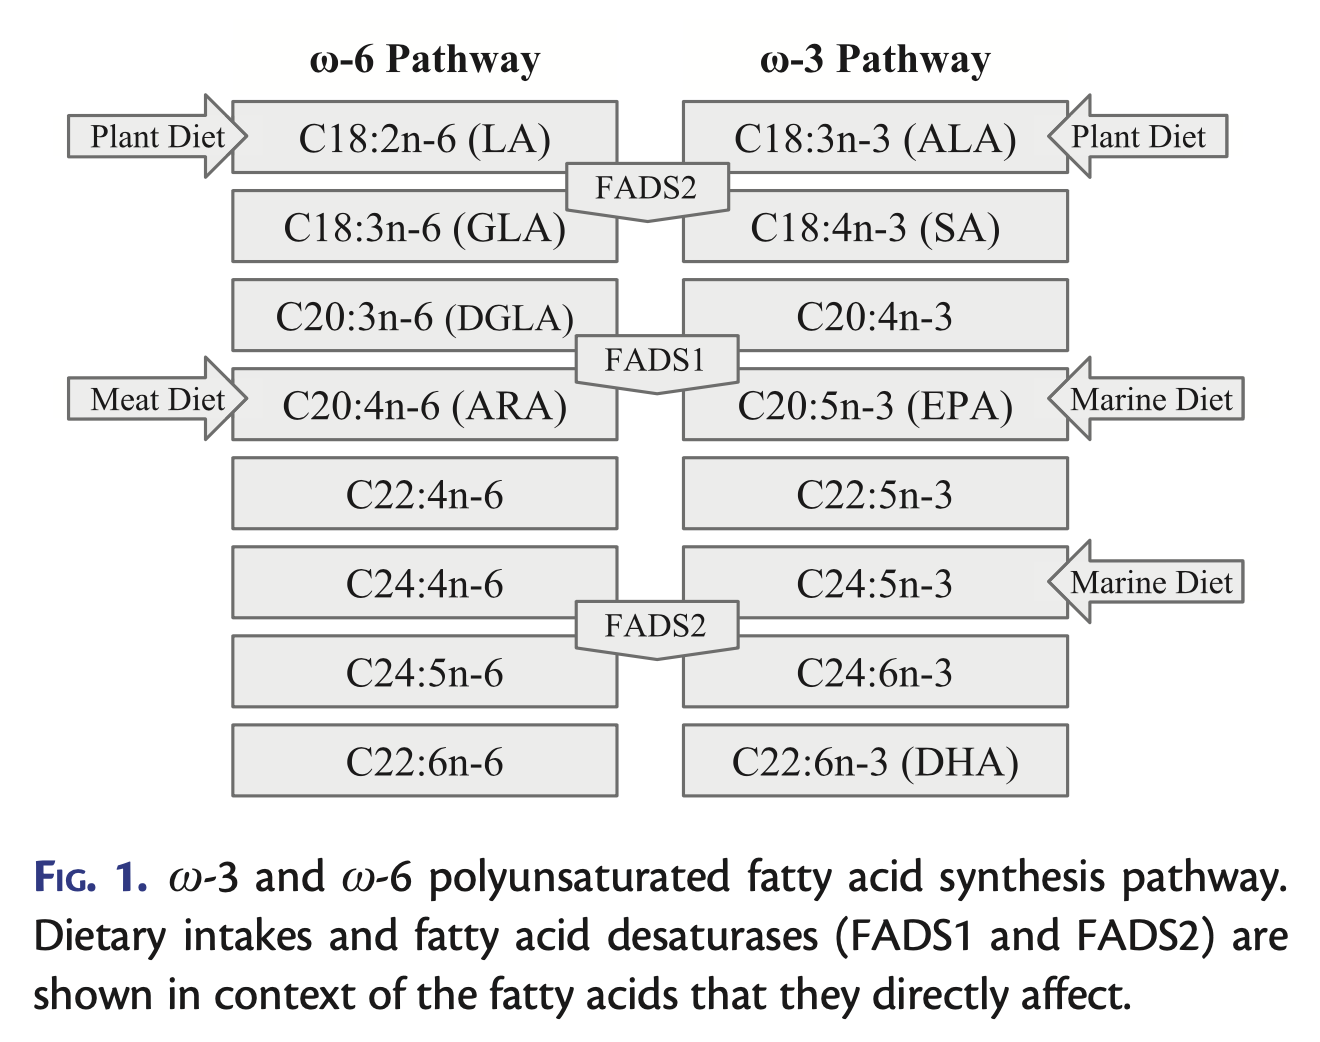
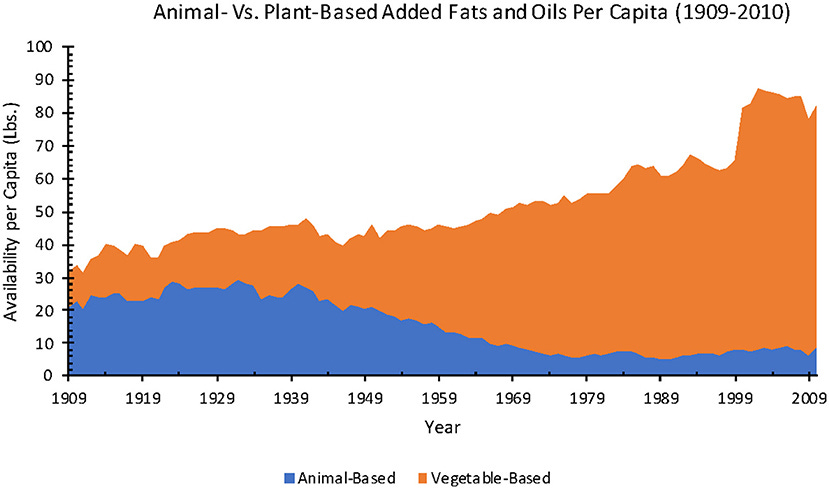
Two key enzymes that act on linoleic (ω-6) and α-linolenic acid (ALA; ω-3) are FADS1 and FADS2, which desaturate PUFAs (add C-C double bonds). Linoleic acid and ALA both come from the diet and cannot be endogenously produced by humans. Plant foods are the main source of both, with most present-day linoleic acid (ω-6 PUFA) coming from seed oils. The concentration of ω-6 PUFAs in industrial seed oils is far beyond anything ever experienced before industrialization.

FADS1, FADS2, and other enzymes transform linoleic acid and ALA into arachidonic acid and eicosapentaenoic acid (EPA), respectively. From there, those can be transformed into a variety of other fatty acids and effector molecules. Arachidonic acid and EPA can also be consumed in the diet, coming mainly from animal meat and marine animals. The important thing here is that FADS enzymes are crucial for the transformation of dietary PUFAs into these long-chain PUFAs which, from there, can be further transformed into other compounds that influence our cells.
Stare at the graphic below for a moment, focusing on where FADS2 and FADS1 sit in the LA —> ARA and ALA —> EPA transformation chain. Consider the types of whole foods from which people get different PUFAs.
Diet determines the total pool of PUFAs your body has at its disposal. The activity of your FADS enzymes (among other things) determines what your body actually does with those PUFAs—the pattern of effector molecules you generate, influencing cell behavior. If two people eat identical diets but differ in FADS enzyme activity, a different pattern of PUFA-derived effector molecules will be produced. Each person’s cells will therefore behave differently, to some extent or another.
FADS and other metabolic enzymes have been evolving for all of human evolutionary history, changing as people adapted to different natural environments around the world. Evolutionary change has taken place since the origins of modern Homo sapiens’ split from Neanderthals, through the Agricultural Revolution and into the present.
This type of population diversity is one reason why there is no universal, one-size-fits-all human diet. As we will see below from randomized trials, people with different FADS genetics can respond differently, even in opposite directions, to a given change in dietary PUFA intake.
The next section examines genetic variation in FADS enzymes and its impact on PUFA metabolism in human trials. Notably, FADS and other enzymes are also modulated by environmental factors, such as micronutrients (e.g., vitamins A and B12), trace minerals (e.g., iron and zinc), and plant polyphenols, as summarized in this review.
Although this review focuses on diet, the Agricultural Revolution also transformed population density, social structures, pathogen diversity, and infectious disease risk. PUFAs are metabolized into molecules influencing hunger, metabolism, inflammation, immunity, brain development, and cognition. Evidence suggests natural selection shaped human biology over the past 10,000 years. Every biological process requires energy, so it’s no surprise that these things are connected.

FADS Evolution & Human Metabolic Diversity
Metabolism is complex by itself. Adding population genetics into the mix can be daunting. Population genetics is essentially a branch of applied statistics. By looking at the genetics of many individuals in different populations across time, you get evolutionary population genetics, the quantitative study of how populations change from generation to generation.
Learn more about evolution & genetics:
M&M 166: Evolution: Natural Selection, Genetic Drift, Origin of Life, Cellular Complexity, Epigenetics | Michael Lynch
Two important technology-related advancements have led to a golden age in human evolutionary genetics: genome sequencing got much cheaper, and people figured out how to extract genetic material from very old samples. As a result, scientists have been sequencing lots of ancient human genomes.
By comparing large numbers of genomes from present-day people and comparing them to ancient genomes, scientists have begun to piece together the genomic details of human evolutionary history. In some cases, they can use population genetic analyses to reconstruct how different lineages spread, died out, and interbred with one another, ultimately giving rise to the pattern of human diversity we see today.
I will do my best to compress the complexity into key observations to human PUFA metabolism. We will focus solely on FADS1 and FADS2, two key enzymes. For more background and context on this particular story, or human metabolic evolution more generally, start with the content below.
Learn more about the evolution of human diet & metabolism:
Podcast: Evolution & Genetics of Human Diet, Metabolism, Disease Risk, Skin Color and Origins of Modern Europeans | Eske Willerslev
Article: What Did Humans Evolve to Eat?
FADS1 & FADS2 Variation Around the World
The FADS cluster comprises three genes: FADS1, FADS2, and FADS3—located close together on chromosome 11. Genes close together on chromosomes like this tend to be inherited together. The term for a cluster of co-inherited genes is “haplotype.” The term for variants of one gene is “allele.” It’s common in evolution for some segments of chromosomes to get duplicated.
The trio of FADS genes likely arose from duplication events. With redundant copies of a gene, one is “free” to mutate in a new direction. As a result, duplicated genes often evolve similar but divergent functions, such as encoding enzyme variants that operate on, in this case, similar fatty acids. That’s basically the story of FADS1 and FADS2 (we know less about FADS3). FADS1 and FADS 2 are similar but not identical. Each gene has multiple variants (alleles). The specific combination of FADS variants (haplotype) you have determines how readily linoleic acid (ω-6 PUFA) gets processed into arachidonic acid. Ditto for the ω-3 pathway from ALA to EPA.
If we both consume the same seed oil-rich diet, you might convert more of the linoleic acid into downstream PUFAs than me. For each of us, a different amount of linoleic acid will circulate in our blood, get incorporated into cell membranes and adipose tissue, or convert to arachidonic acid and on from there. The key is that, even if all else is equal, distinct FADS haplotypes will result in a different pattern of PUFA production and distribution, and therefore different health outcomes.
These genetic differences impact health outcomes, including cardiovascular risk, cognitive development, and immune function, and interact with diet to shape complex traits.
Two major FADS haplotypes
Multiple FADS haplotypes exist, but two occur at much higher frequency than the others. “Haplotype D” converts linoleic acid and ALA into downstream LC-PUFAs more readily than “Haplotype A”. In people of European ancestry, “Haplotype D” is about twice as common as “Haplotype A”.

Each haplotype is more or less common in different human populations, depending on ancestry. Here’s a global frequency map for each. Keep in mind this is based on genetic ancestry, not current geographic residence. If you’re recent ancestors trace back to East Africa but you moved to Central America, you likely have the FADS haplotype most common in Africa (D) rather than the one common in people of Native American ancestry (A).
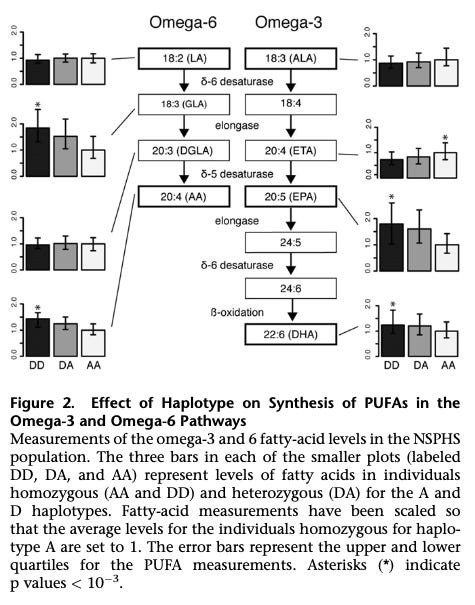
What’s the functional difference between Haplotype D and Haplotype A, according to this paper?
Haplotype D is associated with enhanced ability to produce arachidonic acid and EPA/DHA from dietary ω-6 and ω-3 precursors. People with Haplotype D more readily transform linoleic acid and ALA into long-chain PUFAs.
The effect is not subtle. On average, individuals homozygous at haplotype D had 24% higher DHA and 43% higher arachidonic acid levels than those with Haplotype A.
Overall, Haplotype D is associated with higher blood lipid levels than Haplotype A.
Haplotype D individuals express FADS more highly in the liver, explaining why we see this pattern.
From the global frequency map above, we can see these basic patterns in FADS genotype across populations based on genetic ancestry:
Most people of African ancestry are Haplotype D.
A majority of people with European, Middle Eastern or South Asian ancestry are Haplotype D, but roughly one-quarter to one-third are Haplotype A.
Those with East Asian or Oceania ancestry are a roughly 50:50 split, on average (with lots of variation between specific lineages).
Native American populations are mostly Haplotype A.

All other things being equal, how would you expect Haplotype D and Haplotype A people to differ in the modern seed oil-rich environment? Haplotype D more readily converts dietary plant PUFAs than Haplotype A. Therefore, in response to linoleic acid intake (seed oils) we expect Haplotype D people to produce more arachidonic acid and downstream derivatives, including pro-inflammatory eicosanoids, endocannabinoids, and so on.
In contrast, Haplotype A people should be relatively more sensitive to the direct effects of linoleic acid, which has been linked to certain forms of cancer and is subject to lipid peroxidation, producing toxins that can drive cell death and dysfunction.
How do patterns of human genetic variation in FADS relate to spatiotemporal patterns of diet variation among traditional populations, such as relative balance of plant and animal foods?
Plant vs Animal Diets & the Global Distribution of FADS Haplotypes
Some of us convert dietary PUFAs into long-chain PUFAs more readily than others (Haplotype D). Like everything in biology, this probably comes with tradeoffs. I suspect that each haplotype comes with different potential advantages and disadvantages. The specific way they manifest will depend on food environment you’re in (what you eat).
More readily converting linoleic acid and ALA to long-chain PUFAs (Haplotype D) would be advantageous in environments shifted toward higher linoleic acid and ALA intake (plant PUFAs), and lower arachidonic acid and DHA intake (animal PUFAs). Historically, in traditional populations, there was less reliance on animal foods closer to the equator (growing seasons are longer), and in times and places where farming became common. This may be why haplotype D is more common in people of African, European, and Asian ancestry. Consistent with this, the ethnographic record reveals a systematic relationship between latitude and reliance on animal-based foods: the further from the equator, the greater reliance on animal foods. Keep in mind we’re talking about relative bias here—even for near-equatorial populations, animal foods provide 50% or more of calories for the majority of populations.

Haplotype A is less effective at converting linoleic acid and ALA into downstream long-chain PUFAs. Where is Haplotype A most common? It dominates in those of (native) American ancestry. In M&M 199, we examined evidence that the Clovis, Ice Age ancestors of many Native American populations, consumed a near-carnivore diet. The diet of Paleo-Eskimos was rich in marine animals, and they too had Haplotype A. In both cases, we’re talking about people that lived in cold environments lacking in plant foods, but rich in animals. The Clovis ate similarly to saber-tooth cats (mammoth specialists), a “keto-carnivore” diet which would have been high in long-chain PUFAs. The more readily available long-chain PUFAs like arachidonic acid and EPA/DHA are in the food supply, the less evolutionary pressure there would be to maintain a more highly expressed FADS gene variants. As the Clovis moved South and spread out over time, they gradually turned into other Native American groups.
Whatever the exact details of why this pattern of FADS diversity evolved, we know for sure that it did, resulting in the above distribution pattern. Analysis of ancient genomic data indicates that FADS genes have been subject to selection pressures for 100,000s of years, since the split with Neanderthals. Natural selection “tuned” this aspect of fat metabolism in different directions, in different populations.
A pattern of evolutionary change like this indicates that adjustments to PUFA metabolism have consequences for health and survival, and that the direction of change depends on environmental (dietary) context. Collectively, this tells us that shifts in PUFA intake are likely to have significant health consequences for all people, irrespective of genotype—otherwise, we would not see genomic signatures of positive selection that correlate so well with historical shifts in dietary patterns.
When and where have the most dramatic shifts in PUFA intake taken place? Today, in virtually every part of the world that has been consumed by industrial modernity. In evolutionary terms, that’s the blink of an eye. Even if we knew nothing at all about PUFA biology, it is very, very unlikely that the human body would be well-adapted to process the dietary PUFA cocktail most present-day humans consume by default.

No ancestral human population anywhere in the world, of either major FADS haplotype, ate a PUFA diet remotely close to what modern people consume today. I suspect that in the present-day food environment, each FADS haplotype predisposes people to different harms from high PUFA intake (more on that below).
Before looking at how I use personal genomic data to think about my own metabolism in evolutionary context, let’s look in more detail on how the FADS genes have evolved since the Agricultural Revolution, right up to the present day.
FADS1 and FADS2 Variation in Europe Since the Agricultural Revolution
Let’s briefly consider FADS gene variation in people of European ancestry, focusing on what we know about diet, lifestyle, and FADS metabolism. Part of the reason for my focus on Europeans here is that there’s quite a bit of research on FADS variation for these populations since the Neolithic era began. Another reason is that, below, I will use some of my own genomic data to illustrate how to leverage personal genomics to understand how your own metabolism is biased. As you’ll see, I have what you might call a “European Neolithic farmer” metabolism, which influences how my body processes dietary PUFAs.
For more detail on patterns of genetic variation in human fat metabolism around the world, see these resources:
Learn more about patterns of global metabolic variation around the world:
Podcast: Evolution & Genetics of Human Diet, Metabolism, Disease Risk, Skin Color and Origins of Modern Europeans | Eske Willerslev
Paper: Adaptive Evolution of the FADS Gene Cluster within Africa
Paper: Genetic Adaptation of Fatty-Acid Metabolism: A Human-Specific Haplotype Increasing the Biosynthesis of Long-Chain Omega-3 and Omega-6 Fatty Acids
In simplified terms, the genetic origins of present-day Europeans resulted from the mixture of three main ancestral groups: Neolithic farmers from Anatolia, Yamnaya steppe pastoralists, and Mesolithic hunter-gatherers. These peoples migrated, interacted, and interbred at different times and places, shaping the genetic landscape of Europe.
Farmers—Originating in the Near East (Anatolia), these groups migrated into Europe around 8,000–7,000 years ago, bringing agriculture. They mixed with local hunter-gatherers, especially as they moved west, and their genetic legacy is strongest in southern Europeans. Their diet would have contained relatively more plant PUFAs from farmed crops like grains.
Pastoralists—Around 5,000–4,500 years ago, Yamnaya people from the Pontic-Caspian steppe migrated into Europe, bringing new gene variants and languages. Their ancestry is now found throughout Europe, especially in central and northern regions. They consumed high levels of animal foods like dairy and meat.
Hunter-gatherers—Indigenous to Europe before the arrival of farming, these populations contributed significantly to the ancestry of all modern Europeans, especially in the north and west. Their genetic signature is distinct and closely related to modern northern Europeans. Presumably consumed some mixture and plant and animal foods different to some extent from both sedentary Neolithic farmers or nomadic steppe pastoralists.
The basic, simplified idea is that everyone of European ancestry living today is some mix of these three ancient populations. Some modern Europeans may be a good mix of two or three, while others may be more heavily rooted in one. The specific mixture any given person harbors relates to patterns of metabolic difference and food tolerance we observe among people today, including lactose tolerance and ability to digest starch and carbohydrates generally.
Recall that, across the board, both of the major FADS haplotypes are found in modern Europeans. A majority have Haplotype D, which is better at converting medium-chain plant PUFAs into long-chain PUFAs; perhaps one-third have Haplotype A, which does not convert plant PUFAs as readily.
My suspicion is that Europeans with more ancestry from early farmers are more likely to have Haplotype D, helping them convert linoleic acid and ALA into longer chain PUFAs in a more grain-rich food environment. Again, we’re talking in relative terms here—all of these populations consumed both plants and animals, ranging from a comparable mix of both (Neolithic farmers) to a stronger animal food bias (steppe pastoralists). None were consuming vegetarian diets with anywhere near the ω-6 PUFA content seen in the modern food environment.
Important points worth emphasizing:
Knowing your FADS haplotype requires DNA sequencing. This is especially true for people with European, Asian, or Oceanic ancestry, where there’s a roughly 66/33 to 50/50 mix of both haplotypes.
Each haplotype represents a different baseline biochemical tendency, not a “better” or “worse” fat metabolism. Both haplotypes will convert dietary PUFAs to some extent. It’s a matter of degree.
PUFA intake is much higher today than it was for any ancestral human population. It is unlikely that ultra-high PUFA intake is “good” for one FADS haplotype and “bad” for the other. Ultra-high intake may be bad in one set of ways for Haplotype D, bad in another for Haplotype A.
There is no reason to believe that evolution has ended for humans or that natural selection does not still operate on us. The evidence is clear that FADS genes have been under strong selection pressure in just the past few thousand years. There’s genomic evidence that these and other genes remain under selection pressure today. Maternal diet composition affects development in myriad critical ways, with fatty acid composition having a marked impact on neurological development.
Consider modern commercial baby formulas, “scientifically” engineered by pharmaceutical corporations like Abbott Laboratories. These formulas are often a cocktail of seed oils, corn syrup, and dozens of other ingredients, with fat and nutrient profiles that deviate wildly from natural breast milk. I’m not going to connect all the dots for you here, but it just so happens that fertility rates are dropping precipitously for the segments of the population most adherent to “modern Western medicine,” or whatever you want to call it.
Meanwhile, populations like the Amish are producing healthy babies, with almost none of the various forms of metabolic disruption now commonplace among the general population. Crunch some numbers and you’ll see that it’s inevitable that the human genetic landscape will be drastically change within just a few generations. Even if only one minor factor among many, the developmental and reproductive consequences of fat metabolism will play a role in how human evolution unfolds from here.
Given that people display significant intrinsic differences in PUFA metabolism, and that the modern food environment contains dietary PUFAs at levels never before seen in human history, ultra-high PUFA intake should be having different effects on people based on their FADS haplotype.
As it turns out, clinical studies have been done to examine how people of each FADS haplotype respond to diets enriched in ω-6 or ω-3 PUFAs.
What have they found?
Impact of FADS Variation in Human Clinical Trials
Researchers in Finland have conducted a number clinical studies in people sorted by FADS genotype. I will briefly summarize the results of a few. For consistency, I’ll express things in terms of Haplotype D vs. Haplotype A, rather than using other genetic terminology. (Some studies refer to the “TT” and “CC” genotypes of a single FADS gene, rather than the two principal FADS haplotypes discussed above).
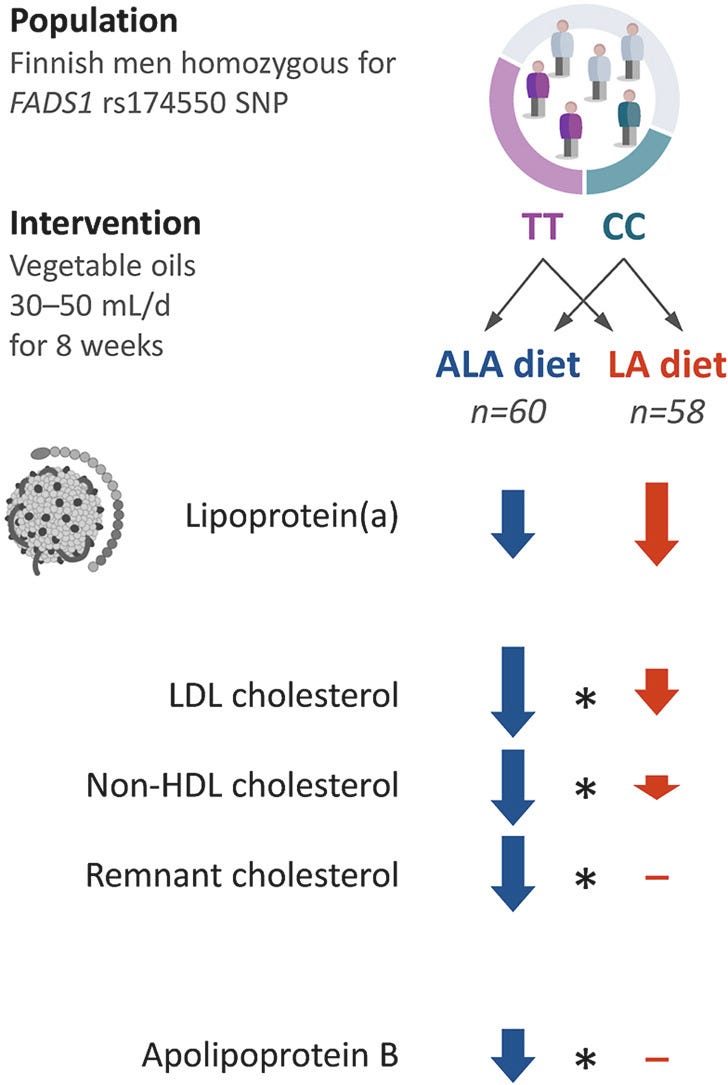
Diet-induced differences in plasma PUFA levels by FADS1 genotype
A pair of randomized trials (here and here) looked at over 100 men each, with subjects by FADS1 genotype. One subset was homozygous for a FADS1 variant that more readily generates long-chain PUFAs, as with Haplotype D. The other subset were homozygous for a FADS1 variant that less readily converts PUFAs, as with Haplotype A.
Recall where the FADS enzymes operate in the dietary PUFA conversion chain. These studies separated men based on FADS1 genotype only. We don’t actually know their FADS2 genotype, although the two genes are adjacent to one another on the same chromosome, so there will be a very strong correlation between which FADS1 and FADS2 alleles one carries.
FADS1 controls the rate of ARA (ω-6) and EPA (ω-3) production, but requires PUFA products downstream of FADS2 for its substrates. We therefore expect the two groups to differ in levels of serum lipids measured from the step FADS1 operates onward, i.e. the production of arachidonic acid and EPA. We expect linoleic acid and ALA to increase in both groups when they eat more of either plant PUFA, as increased intake and absorption does not depend on FADS1.
Men of each genotype were randomized to eat either a higher ω-6 PUFA diet (sunflower oil, rich in linoleic acid), or ω-3 PUFA diet (with ALA from a different plant oil). Diets were not totally controlled—subjects were instructed to consume either the n-6 or ω-3 oil on their own, together with low-fat meat and dairy. Food diaries were kept and checked for compliance, but subjects ate ad libitum with these instructions in mind. Diets were therefore not identical for all subjects in terms of calories and nutrient content. On the one hand, this probably introduces greater variance in the data; on the other hand, it’s more naturalistic in the sense that people are free to eat as much or as little as they please—more variable than a strictly controlled diet, but also an intake pattern more akin to how people eat “in the wild.”
Caveats: Even in the 8-week “high” linoleic acid group, the linoleic acid from sunflower oil only represented ~10% of daily energy. The average BMI of subjects was just under 25, right at the border of “normal” and “overweight,” well below the typical cutoff for “obese.” By contrast, the average American today may be consuming >20% of calories from linoleic acid, with significantly more body fat. Thus, the linoleic acid content of this diet, as well as the PUFA composition of subjects’ tissues, were likely much less than the average American today. Lastly, 8-weeks is a fairly lengthy period of time to run a human trial like this, but as discussed here, we expect many effects of a high-PUFA diet to take months or years to fully manifest.
Basic results on plasma changes in dietary PUFAs and their enzymatic derivatives:
High linoleic acid diet (ω-6):
Linoleic acid increased in both genotypes, in both studies.
ALA decreased in both genotypes, in both studies.
Arachidonic acid did not change for the TT genotype (Haplotype D), and decreased for the CC genotype (Haplotype A), in both studies.
High ALA diet (ω-3):
ALA increased in both genotypes, in both studies.
Arachidonic acid decreased in both genotypes, in both studies.
EPA significantly increased in the TT genotypes (Haplotype D) but increased less in the CC genotype (Haplotype A), for both studies.
A graphical summary of the results (from this study):

So, increased dietary intake of either linoleic acid (ω-6) or ALA (ω-3) increases plasma levels of that PUFA in both genotypes. However, what happens with downstream PUFA levels depends on genotype. This much should make intuitive sense. Ingesting more of either dietary PUFA increases plasma levels in everyone. The two genotypes differ in FADS1 activity, which operates on PUFAs a couple of steps downstream of dietary plant PUFAs, so people diverge at the level of FADS1 products: arachidonic acid (ω-6, derived from linoleic acid) and EPA (ω-3, derived from ALA).
The “Haplotype D” people have greater FADS1 expression. All other things bring equal, we expect them to produce more arachidonic acid and EPA from linoleic and ALA, respectively. They did observe that pattern for the high-ALA diet, which resulted in a greater EPA increase in Haplotype D. They did not observe an increase in arachidonic acid in the Haplotype D group in response to the high linoleic acid diet, however. Instead, they observed no change for the Haplotype D group and a decrease for Haplotype A. I’m not sure why, but the result was seen in both studies. A couple processing steps occur between linoleic acid and FADS1, so it’s possible something else is going on between linoleic acid absorption and FADS1 operation. The key thing is that, for either ω-6 or ω-3 PUFAs, dietary intake produces a different pattern of downstream PUFA change in people depending on genotype.
Key point: diet effects varied by genotype, so pooling data across groups could hide significant changes specific to one subgroup. Many assume bigger sample sizes always help detect “statistically significant” effects. But that only holds if your samples come from similar populations. If your sample includes two or more subgroups that differ in traits you care about—defined by genetics or some other factor—then pooling everyone together can obscure those differences. Most human trials ignore genomic variation. Plenty of “negative” results, like no diet or drug effect, might actually hide real differences between subgroups. Studies often assume people are biologically interchangeable, treating variation as noise to average out. But real and important signal can be averaged away, too.
These two studies show us that genetic variation in fat metabolism can lead to different diet-induced lipid patterns. But as I’ve previously emphasized, most of the relevant biology we care about for PUFAs will be happening in tissues, after PUFAs become incorporated into cell membranes and adipose tissue. Fatty acids can remain integrated into tissues for a long time, and may or may not undergo lipid peroxidation at any given moment. When and whether or not this happens depends on the overall level of oxidative stress someone experiences, which can vary within and between people over time.
The baseline expectation (at least for me) with regard to PUFAs, inflammation, and metabolic dysfunction is that we expect these things to increase over time, in proportion to the rate at which inflammatory arachidonic acid derivatives are produced and dietary ω-6 PUFAs like linoleic acid become incorporated into cell membranes and fat tissue.
Does FADS genotype influence patterns of, say, mitochondrial metabolism in adipose tissue? If you’re paying attention, the prediction should be, “Yes.”
Learn more about the biology and health effects of seed oils:
Article | PUFAs & The Palisades: Lipid Peroxidation, Oxidative Stress & Cell Death
Article | Seed Oils, Early-Onset Cancer & Human Metabolic Variability
Effect of genetic FADS variation on mitochondrial metabolism
Similar to the pair of trials discussed above, this one looked at over 100 men, separating them by FADS1 alleles, except that they analyzed adipocytes (fat cells) from people of both genotypes (obtained from biopsies). As above, this was done after randomizing subjects of both genotypes to an enriched linoleic acid (ω-6) or ALA (ω-3) diet for an 8-week period. They also analyzed samples from a smaller cohort of obese men.
In short, they found differences between the two genotypes, at baseline and in response to the 8-week dietary interventions. This included differences in PUFA levels and mitochondrial function assessed in cells derived from adipose tissue. Here are the baseline differences in PUFA levels for the two genotypes. Notice that the significant differences in arachidonic acid, higher for those the the TT allele (Haplotype D).

There were also baseline differences in the ratio of mitochondrial to nuclear DNA, which was higher in differentiated cells from Haplotype D individuals (those with great FADS1 activity). A higher mtDNA:ncDNA ratio can indicate greater mitochondria content or biogenesis (higher energy demand). This value was much higher in Haplotype D (TT allele) than Haplotype A (CC allele) individuals, indicating baseline differences in mitochondrial metabolism.

There were also substantial differences in the expression levels of several genes between the two genotypes, including those related to mitochondrial function and fatty acid oxidation. In most cases, gene expression was higher in the Haplotype D (TT allele) individuals, further indicating baseline metabolic differences between genotypes.
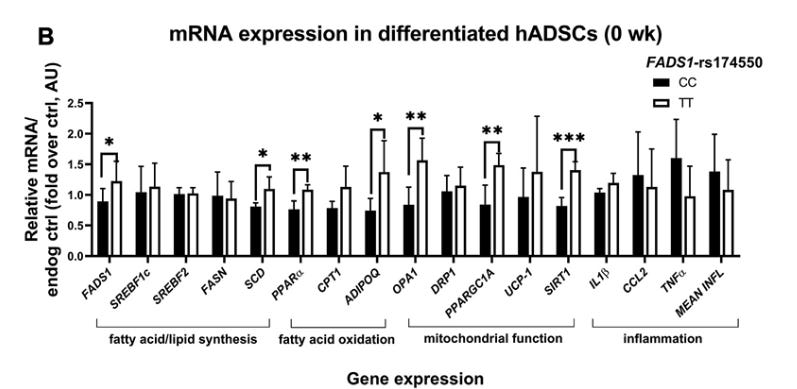
Similar to the studies we looked at above, the effects of the 8-week high linoleic acid (ω-6) and ALA (ω-3) diets produced a different pattern of change in each genotype. For example, each diet produced a different pattern of mtDNA change between the two genotypes, as well as a different pattern of gene expression change in adipose tissue-derived cells. Notice the changes in genes related to inflammatory molecules (e.g. TNFα), lipid metabolism (e.g. PPAR), and mitochondrial respiration (e.g. UCP-1).

Important general takeaways:
There are significant baseline differences in mitochondrial metabolism between people of each. genotype
Enriched linoleic acid (ω-6) and ALA (ω-3) diets produce different patterns of change, and do so differently for each genotype.
Once again, many of these changes would likely not be detected if all the subjects were pooled together, without sorting by genotype. Collectively, all of these results illustrate the importance of sorting people based on their intrinsic metabolic differences (genotype). It also emphasizes the fact that dietary interventions are not one-size-fits-all. Enriching one component of the diet can exert beneficial effects for someone with one genotype, and neutral or detrimental effects for another.
The authors in their own words:
Responses to PUFA-enriched diets differed between the genotypes of FADS1-rs174550, showing that ALA, but not LA-enriched diet stimulated mitochondrial metabolism more in subjects with the CC genotype [Haplotype A] when compared with subjects with the TT genotype [Haplotype D]. ALA, but not linoleic acid, proportion in plasma phospholipid fraction correlated positively with adipose tissue mitochondrial-DNA amount in subjects with the CC genotype of FADS1-rs174550 in the [obese subgroup]. These findings demonstrate that the FADS1-rs174550 is associated with modification in mitochondrial function in human adipocytes. Additionally, subjects with the CC genotype, when compared with the TT genotype, benefit more from the ALA-enriched diet, leading to enhanced energy metabolism in human adipocytes.
Reading about all of this got me thinking: what FADS haplotype do I have? How does that relate to my ancestry, and mitochondrial haplogroup? Looking at my personal genomic data allowed me to stitch together a picture of my “metabolic type,” including why I have it (i.e. what my ancestral lineages are) and things I might do to mitigate possible health risks related to how my metabolism is biased.
Using Personal Genomics Data To Understand Your Own Fat Metabolism
Advances in technology have made genome sequencing pretty cheap. Getting personal genomic data for yourself can be very informative and fun to browse. However, you should also be mindful about data security, which will vary depending on which service you use. Do your research.
After obtaining personal genomic data, you can export it, which will be either a file of SNPs for specific genes and/or a full genome sequence. There are fancy ways to analyze this data on your own, and various products out there have graphical interfaces that allow you to explore your genome. One of the simplest, low-effort things you can do is a simple text search of exported data, looking at any gene of interest. For example, in the clinical studies we just looked at, they segmented their subjects by FADS1 allele, which was, “rs174550.” Those with “TT” are Haplotype D, who more readily convert dietary plant PUFAs to long-chain PUFAs. Haplotype A individuals are “CC” here.
So, I searched for “rs174550” in my own genomic data.
Drumroll…
I am “TT” for the FADS1 gene, which means I’m probably Haplotype D for my FADS genes. This is what I expected, given my ancestry. My paternal lineage traces back largely to Greece, while my maternal lineage traces through places in North and Central Europe, such as Lithuania. Given these facts alone, there was a good shot I was Haplotype D. Looking at other SNPs (single nucleotide polymorphisms) confirmed this, consistent with Neolithic farming ancestry.
For both FADS1 (Δ5-desaturase) and FADS2 (Δ6-desaturase), I had the “major allele” for each of the several SNPs I have personal data for. In other words, my FADS1/2 alleles strongly favor conversion of dietary plant PUFAs into downstream, long-chain PUFAs. For me, linoleic acid and ALA will convert into downstream PUFAs more readily than just about anyone. My ancestors were probably eating a “farming diet” for about as long as that has existed.
What does this tell me? Because I’m a “strong” dietary PUFA converter, I’m probably more sensitive to derivatives of dietary PUFAs and less prone to accumulate dietary plant PUFAs in my tissues, compared to people with a different FADS profile. In terms of seed oil consumption, this may make me relatively less prone to the direct effects of linoleic acid, such as its ability to drive cancer via mTOR signaling or accumulate in my tissues and potentially undergo lipid peroxidation to produce toxins.
At the same time, because my cells more readily convert linoleic acid to downstream PUFAs like arachidonic acid, I may be more prone the effects of those compounds, including inflammatory lipids like prostaglandins. Other downstream PUFA-derived compounds called thromboxanes have also been implicated in cancer metastasis.
So what concrete things can I do to mitigate risk here? Three simple ideas:
Minimize consumption of seed oils and foods with high n-6 PUFA content. Aim for low absolute intake levels of n-6 PUFAs and a balanced n6:n3 ratio. The lower the pool of dietary n-6 PUFA I consume, the less substrate there is for my “aggressive” FADS genes to convert into downstream inflammatory lipids or other compounds.
Ensure adequate ALA (n-3) intake. As we saw in the clinical results above, enriched ALA diets were able to lower arachidonic acid levels in people of either FADS haplotype.
Aspirin inhibits the enzymes that convert arachidonic acid into downstream inflammatory lipids like prostaglandins, as well as thromboxanes. This may be why it was recently shown to inhibit cancer metastasis. Intermittent use of aspirin may be helpful at times.
Final thoughts
The genetic variants we have don’t strictly determine our fate or the traits we express. Instead, it’s better (in my opinion) to think of genetic variants as defining basic biological tendencies that you have across environmental contexts. Having certain genetic variants may make things relatively easier or more tolerable in one environment, but have a distinct effect in another.
Remember: none of our ancient ancestors were consuming PUFAs like modern people do today. The absolute amount of ω-6 PUFAs the average person consumes from seed oils today, together with the heavily skewed ω-6:ω-3 ratio, has no precedent in the entire natural history of our species. It’s not that one FADS haplotype makes seed oils and an ultra-high ω-6 PUFA intake “good” for one type of person and “bad” for another. Instead, it’s probably that an ultra-high seed oil diet is bad in different ways, influenced by which FADS haplotype you have.
What are dietary ω-6 PUFAs from seed oils supposed to be good for, anyway?
Well, they’re marketed as “heart healthy” by corrupt organization like the American Heart Association for one reason and one reason only: they can lower LDL cholesterol levels. But they do so only modestly (7-10%) according to trials like this, with linoleic acid (ω-6) having a much lesser impact than ALA (ω-3), for either FADS genotype.
And besides, lower is not always better when it comes to cholesterol, which is why you should do your research before someone tries to reflexively prescribe you a statin because your cholesterol is “high.”
Related M&M content:
Article | Seed Oils, Early-Onset Cancer & Human Metabolic Variability
Article | PUFAs & The Palisades: Lipid Peroxidation, Oxidative Stress & Cell Death
Podcast | Seed Oils, Omega-6 PUFAs, Inflammation, Obesity, Diabetes, Chronic Disease & Metabolic Dysfunction | Chris Knobbe
Podcast | Omega-6-9 Fats, Vegetable & Seed Oils, Sugar, Processed Food, Metabolic Health & Dietary Origins of Chronic Inflammatory Disease | Artemis Simopoulos