


Case Study: To statin or not to statin?
A post-menopausal woman gets blood work. Her doctor recommends statins. Given these numbers, what would you do?

The bloodwork results and patient information came from a real person who (anonymously) shared her information, including the recommendations of their medical professionals. An independent analysis of the case is provided based on published scientific literature. The conclusions and interpretations of data may or may not be consistent with the self-reported recommendation from medical professionals.
M&M content is NEVER medical advice. This should not be taken as a substitute for professional medical advice. Always consult a physician about your experiences and data before making health-related decisions.

Patient: Female, late 50s, post-menopausal, overweight. Not currently taking statins. Consumes alcohol and eats out regularly. Diet is akin to the “Standard American Diet,” with high carbohydrate and added sugar intake. Omega-6 fatty acids via seed oils and processed foods represent a large portion of dietary fat. Does not exercise regularly beyond low-intensity walks.
Bloodwork results: Raw results provided by routine bloodwork
Total cholesterol = 203 mg/dL (flagged “High”)
HDL = 68 mg/dL
Cholesterol/HDL = 3.0
LDL, Calculation = 115 mg/dL (flagged “High”)
Triglycerides = 84 mg/dL
Triglycerides/HDL* = 1.2
*Note: this was not provided in her official report or commented on by her doctor(s).
Professional medical recommendation: Total and LDL cholesterol were flagged as high. Statins recommended. No specific dietary recommendations were given, apart from generic advice to “lose weight.”
Questions: If you were this woman, would you accept the doctor’s advice and start taking a prescription statin, or would you choose not to? What dietary changes might you consider making, if any?
Below is a brief, independent analysis of the bloodwork. Links to supporting data are provided. Any commentary written is from the perspective of someone with similar demographic features who has knowledge of the literature and biology described. None of this represents actual medical advice for anyone. The data and commentary will be of interest to anyone who has in interest in cardiometabolic health, regardless of your personal demographics.
To learn more about statins, diet, and cardiometabolic health, try these M&M podcast episodes:
M&M #135: History of Diet Trends & Medical Advice in the US, Fat & Cholesterol, Seed Oils, Processed Food, Ketogenic Diet | Orrin Devinsky
M&M #140: Obesogens, Oxidative Stress, Dietary Sugars & Fats, Statins, Diabetes & the True Causes of Metabolic Dysfunction & Chronic Disease | Robert Lustig
Scientific papers referenced in this case study:
Association between low density lipoprotein and all cause and cause specific mortality in Denmark: prospective cohort study (2020, link)
A nonlinear association of total cholesterol with all-cause and cause-specific mortality (2021, link)
Total cholesterol and all-cause mortality by sex and age: a prospective cohort study among 12.8 million adults (2019, link)
Elevated Triglycerides to High-Density Lipoprotein Cholesterol (TG/HDL-C) Ratio Predicts Long-Term Mortality in High-Risk Patients (2020, link)
Extreme high high-density lipoprotein cholesterol is paradoxically associated with high mortality in men and women: two prospective cohort studies (2017, link)
Remember, we’re talking about a post-menopausal woman in her late 50s. She is not currently taking statins, widely used to lower LDL cholesterol levels (and a huge money-maker).
Based on the literature cited above and below, here’s how one could think about this case. The studies cited vary in their population size and composition. Most have very large sample sizes and examined the relationship between mortality and either total cholesterol, LDL or HDL cholesterol, or other factors. Like any study, each could be critically evaluated in detail (doing so is beyond the scope of this case study).
Total Cholesterol = 203 mg/dL
For adult men and women, Total Cholesterol levels roughly in the 200-250 mg/dL range are associated with the lowest age-adjusted hazard ratio for mortality. The details vary by age and sex. For all people, there is a U-shaped relationship between Total Cholesterol levels and all-cause mortality:
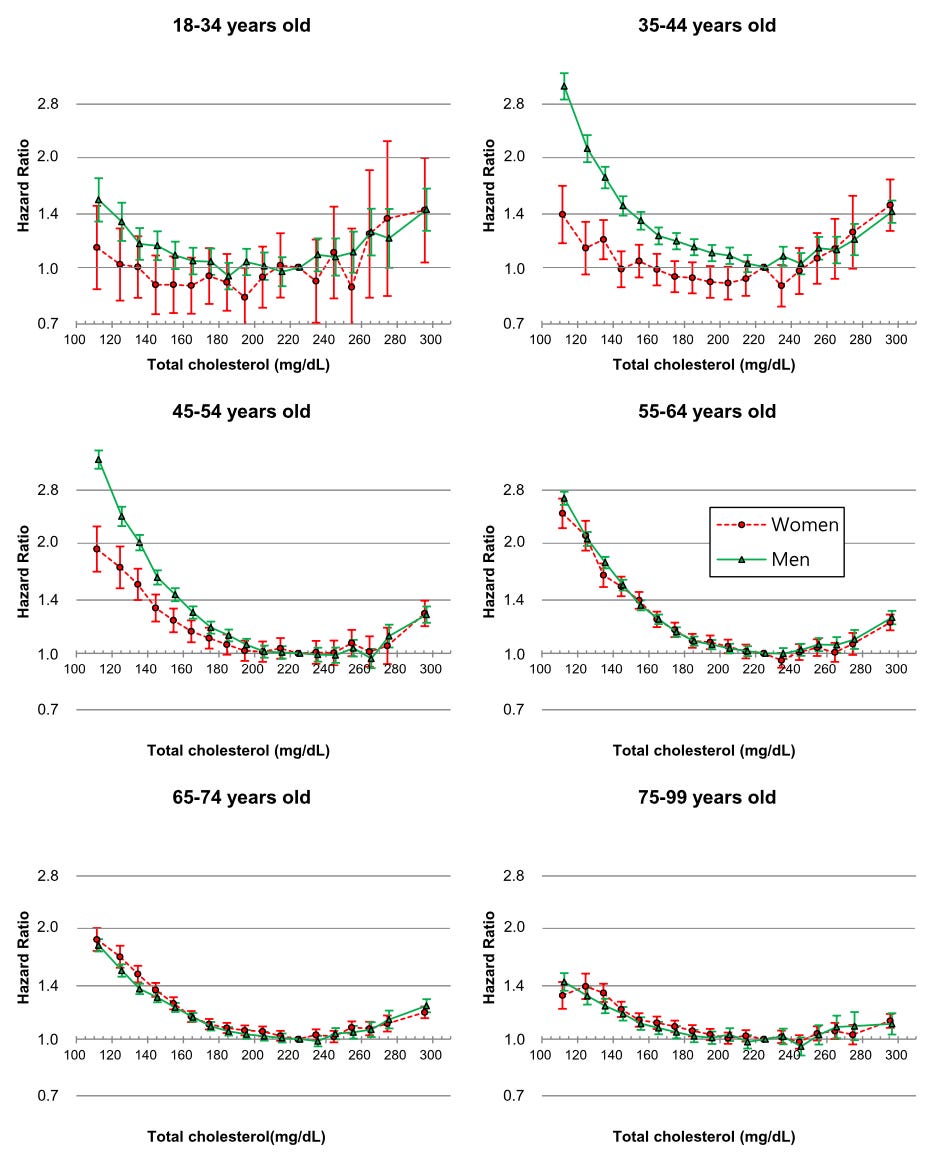
In the study above, based on data from millions of people, the lowest mortality risk is seen with Total Cholesterol (TC) above 200 mg/dL in both men and women for almost all age brackets. For a late 50s woman (middle-right above), “optimal” Total Cholesterol is roughly in the 210-250 range. The reported value was 203 mg/dL, which suggests that a somewhat higher TC would be better for this woman.
Women in their 50s or older tend to have the highest Total Cholesterol levels of any age-sex cohort. On average, TC peaks at just above 210 mg/dL for women at this age. The increase in TC with age is normal. The reason TC is highest in women at these ages is related to the biology of post-menopausal changes.
Putting these things together, women in their late 50s have a TC of ~210, on average. However, the women in this age bracket with the lowest risk of dying actually have higher-than-average TC levels, in the 220-250 mg/dL range. A physician flagged 203 mg/dL as “high,” but this data suggests the opposite.

As people get older (>65), higher cholesterol levels are associated with lower risk of death. In fact, for people 65 or older, the results of this large study (n > 30,000) found an elevated all-cause mortality risk for seniors with Total Cholesterol (TC) below 160. For adult women generally, the lowest all-cause mortality risk is seen with TC = 200-279, which was seen across all people who were not taking lipid-lowering drugs like statins.

Interpretation: Total Cholesterol = 203 is not too high. A statin is therefore inappropriate. In fact, the "ideal" cholesterol level for a post-menopausal woman this age would actually be higher. Believe it or not, increasing TC up to roughly 240 or so could arguably be “optimal.”
HDL = 68 mg/dL
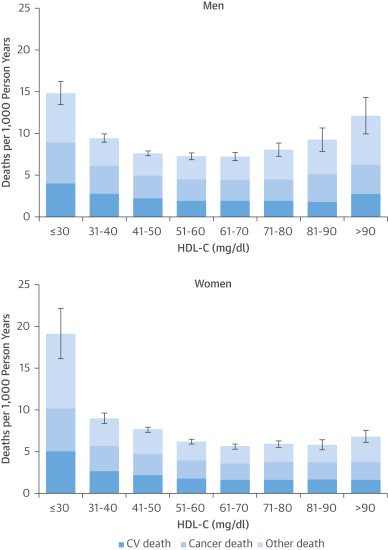
The so-called "good cholesterol." Despite the name, higher is not automatically better—when it's extremely high, it's associated with higher mortality risk. For a woman, "high" would be >116. Extremely high would be >135. Based on this study, with data for n=62,240 women, 69-97 mg/dL has the lowest association of death for adult women of all ages.
Interpretation: HDL at 68 mg/dL is fine and could even go up. While a statin might increase HDL slightly, some of the literature says HDL in the 60-80 range is ideal for women, in terms of minimizing all-cause mortality risk. If it ain't broke, don't fix it.
Cholesterol/HDL = 3.0
Based on standard reference ranges, "Optimal" is <3.5. No need to dwell on this number.
LDL = 115 mg/dL
LDL cholesterol, so-called “bad cholesterol,” is the main number doctors use to inform their statin recommendations. "Bad cholesterol" is a misnomer. LDL-C is an essential part of our biology. As with most things, there's a "Goldilocks zone.” When LDL is too high, the all-cause death risk goes up. When LDL is too low, the risk of death goes up, often even more quickly than when it's too high.
According to a quick search of the official guidelines, "optimal" is <100, and "near-optimal" is 100-129. Even if you follow the guidelines, 115 mg/DL is "near optimal." But do the guidelines actually reflect the science that's out there?
Based on this and other data, the LDL levels with the lowest all-cause mortality risk, adjusted for sex and age, is 132-154. The risk of death increases when LDL exceeds 189. All-cause mortality risk also increases when LDL goes below 113 and starts really going up below 93. When LDL is too low, it's a risk factor for cancer, for example.

Interpretation: A 115 mg/dL value for a woman in this demographic is fine. If I were a post-menopausal woman with these characteristics, I would want my LDL number to get higher, into the 132-154 range. Taking a statin will have the opposite effect.
Possible lifestyle change: To boost LDL levels, consider consuming fewer carbohydrates, especially added sugars and refined grains. Replace omega-6 PUFAs (which lower LDL) with other dietary fats. The most common source of omega-6 PUFAs are seed oils and other ultra-processed foods.
Triglycerides = 84 mg/dL
Based on the standard reference ranges, <150 mg/dL is considered normal, so 84 is fine. This number tends to go up if the liver is producing more fat. It’s usually elevated above 150 mg/dL in people with poor metabolic health and fatty liver disease. As far as I know, one good way for this number to become “too high” is by consuming too much, especially carbohydrates like added sugars.
Interpretation: No concern here. Avoid overeating, especially carbohydrates, to keep this number from getting too high. Evidence suggests that very high levels of fructose intake, especially in the context of a “bad diet” generally, stimulates de novo lipogenesis (fat synthesis) in the liver, raising triglycerides. The combination of omega-6 PUFAs (seed oils) and fructose may be especially bad for the liver. See this content to learn more:
M&M #140: Obesogens, Oxidative Stress, Dietary Sugars & Fats, Statins, Diabetes & the True Causes of Metabolic Dysfunction & Chronic Disease | Robert Lustig
M&M #136: Seed Oils, Omega-6 PUFAs, Inflammation, Obesity, Diabetes, Chronic Disease & Metabolic Dysfunction | Chris Knobbe
Triglycerides/HDL = 1.2
This number is a very important indicator of metabolic health. The official report apparently did not include this easily calculated number. I would personally be very concerned if my physician did not look at this number closely and talk to me about it.
Based on standard references, "optimal" is <2.0, while "high" is >3.0. Even a value of >2.5 is not good. I personally aim to keep this number near 1.0. This number gets to be 3.0 or higher in people with very poor metabolic health. I know people who have Triglycerides/HDL > 5. Not good. It basically points to fatty liver disease. One way to lower this number is significant carbohydrate restriction, such as with a ketogenic diet.
Interpretation: A value of 1.2 suggests pretty good overall metabolic health (although this number alone isn’t the whole story). Restrict carbohydrate intake, especially added sugars and refined grains, to prevent it from creeping up. Ditto for seed oils and processed foods with high omega-6 PUFA content. When this number gets high, it suggests the liver is “stressed.” Preclinical evidence suggests that high omega-6 PUFA intake (seed oils), especially with high fructose intake, is bad news for liver health. Because cholesterol levels are not “too high,” taking a pharmaceutical statin would be just one more thing for the liver to handle.
Overall Interpretation
Cholesterol is not too high. For a post-menopausal woman this age, lower total and LDL cholesterol levels would be associated with a higher mortality risk. Her doctors did not include triglycerides/HDL, but a value of 1.2 is surprisingly good, given that she eats a “Standard American Diet” and consumes alcohol regularly.
If I were this woman, I would choose not to take statins. I would want to elevate my LDL and Total Cholesterol somewhat, and keep an eye on my Triglycerides/HDL in case it started creeping up. For both of these, restricting carbohydrate intake would likely be an effective, natural, and easy change to implement. Even modest restrictions, such as cutting back on processed foods with added sugars or refined grains (e.g. white bread, grain-based snacks), could help.
I would also cut back on foods high in omega-6 PUFAs, such as seed oils. Omega-6 PUFAs lower LDL cholesterol. A woman like this would actually want to see higher LDL levels to minimize mortality risk. Replacing omega-6 PUFAs with other fats is one strategy, perhaps by swapping out seed oils for things like real butter or coconut oil when cooking at home, as well as eating out less (most restaurants make liberal use of cheap seed oils).
Why did the medical professionals who looked at this woman’s bloodwork prescribe her statins without any specific dietary advice? Are they familiar with the scientific literature indicating that all-cause mortality has a U-shaped relationship with Total and LDL Cholesterol levels? Are they aware that there’s evidence to suggest a woman like this might want higher cholesterol levels?
Apparently not.
Why?
Related M&M written content:
The Cholesterol Cult & Heart Mafia: How the process of science evolves into The Science™ of public policy
This is the BEST summary I've seen to date on this controversial topic. I work within this space daily. I thank you immensely.
I really appreciated reading this and learning about the demographic data as well. My cardiologist was pushing statins last September when in about 3 months into a relaxed keto diet my total cholesterol went to 230 and LDL to 163, with triglycerides at 46 and HDL at 59. Since then, continuing with my relaxed keto diet and cutting back somewhat on saturated fats and wearing a CGM I brought my total cholesterol levels to 207, my triglycerides to 34 and LDL to 135. I've done blood work with Levels, whose CGMs I use, and my fasting insulin is 2.3, but my ApoB is around 116, when last year it was 90, so I am not sure what role ApoB would have in my doctor pushing statins for that, should I point out the data I learned from your post. By the way, I am in my early 70s, very active too and have a 0 calcium score.