Eating Fat Like Never Before
The specific fats we consume today are very different from what our ancestors ate.
Not medical advice.
I have previously explored how the rise in general metabolic dysfunction, including obesity, has something to do with the macronutrient composition of our diet—the pattern of dietary fats, carbs, and protein we are consuming. Metabolic health keeps declining, despite decreases in total calorie consumption and increases in active energy expenditure. What we’re eating matters as least as much as how much we eat.
In this post, we looked at obesity and diabetes trends together with broad changes diet composition over time. We then broke down some of the major types of dietary fats and dietary carbs. That foundation sets us up to understand historical trends in macronutrient consumption in more detail.
Here, we will analyze patterns of dietary fat consumption over time and place things in evolutionary context: what patterns of modern fat consumption deviate the most from those of our hunter-gatherer ancestors? Which of these has been the most consistent over time?
Here’s where we are ultimately going:
The pattern of fats we consume is crucial for metabolic health. Over time, we have consumed more plant-derived polyunsaturated fatty acids (PUFAs) at the expense of saturated fats. In particular, we are consuming very high levels of omega-6 PUFAs while often being deficient in omega-3s. This dietary fat profile promotes systemic inflammation, lower basal metabolic rate, and other problems;
The pattern of carbs we consume is also crucial. We are consuming more processed carbs than ever before. The biggest culprit here is added sugar, especially fructose and fructose derivatives. These sugars have negative metabolic effects, ranging from fatty liver disease to insulin resistance and food addiction;
It’s possible to maintain good metabolic health on a high-fat + low-carb diet, or a high-carb + low-fat diet. When you start consuming a diet with moderate-to-high levels of both macronutrients, it favors metabolic dysfunction. This is especially true with consumption of specific types of fats and sugars together—things like omega-6 PUFAs and fructose;
For most of human evolutionary history, we only encountered natural foods having a restricted range of macronutrient profiles. There are almost no natural whole foods that have the combinations of specific dietary fatty acids and carbohydrates we are routinely exposed to today via processed foods.
This post will focus on the first point above: changes in dietary fat consumption that promote inflammation and metabolic dysfunction.
Key questions we will address in this post:
How has the balance of saturated, monounsaturated, and omega-6 vs. omega-3 polyunsaturated fats in our diet changed over time?
What specific types of foods are driving these changes?
In the next post, we will dive into the underlying biology—what are the biological consequences of consuming diets with distinct fat profiles? We’ll cove everything from basal metabolic rate to systemic inflammation, brain function, and all-cause mortality, showing how the fat profile of the modern Western diet impacts each. Later, we will go through a similar exercise for carbs.
Dietary Fat: Broad Trends Across All of Human History
For most of human evolutionary history, we were hunter-gatherers—opportunistic omnivores, eating whatever animal and plant foods we could get. Our ancestors spread across the globe, learning how to extract calories and nutrition from a wide range of food environments.
Inuits eat animal blubber and meat. The Hadza people get up to a fifth of their calories from honey (sugar). For both peoples: very low rates of obesity, diabetes, and cardiometabolic disease. Across all of human prehistory, different people living in different environments ate distinct foods. Virtually none suffered metabolic syndrome. Today, people all over the world are converging on a similar diet and all are becoming metabolically unhealthy.
Here’s a slide from this talk, showing the macronutrient content of the traditional Inuit diet:
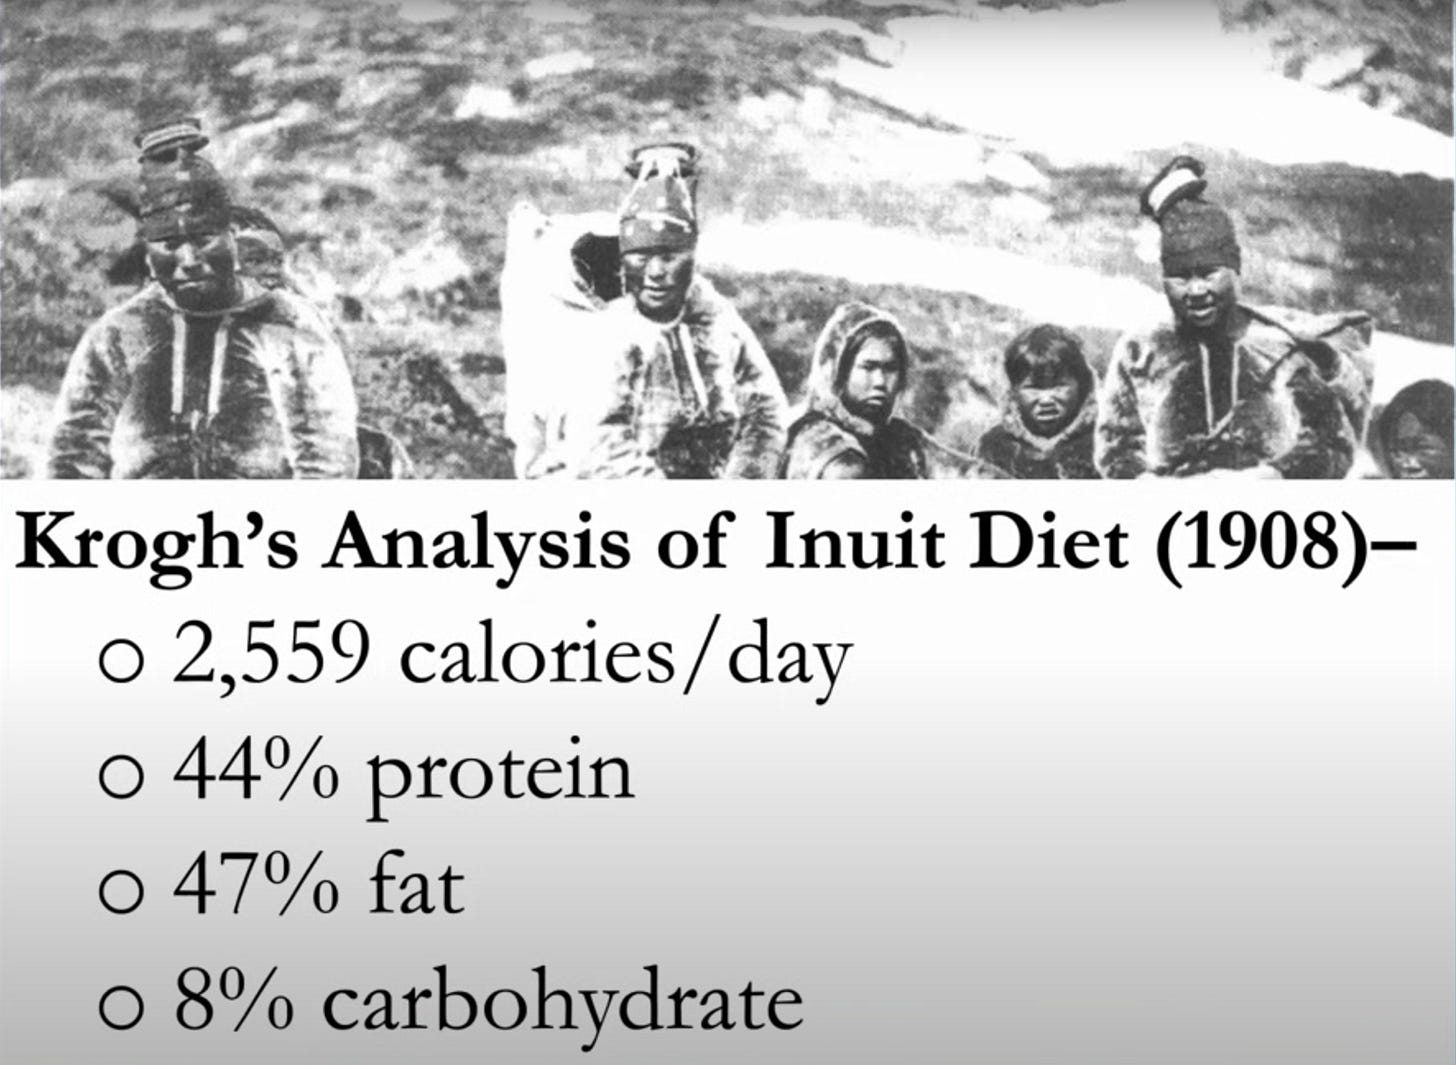
That’s a high protein, high fat, low carb diet. Contrast that with the diet of native Papua New Guineans, an ultra-high carb diet (they eat lots of sweet potatoes):
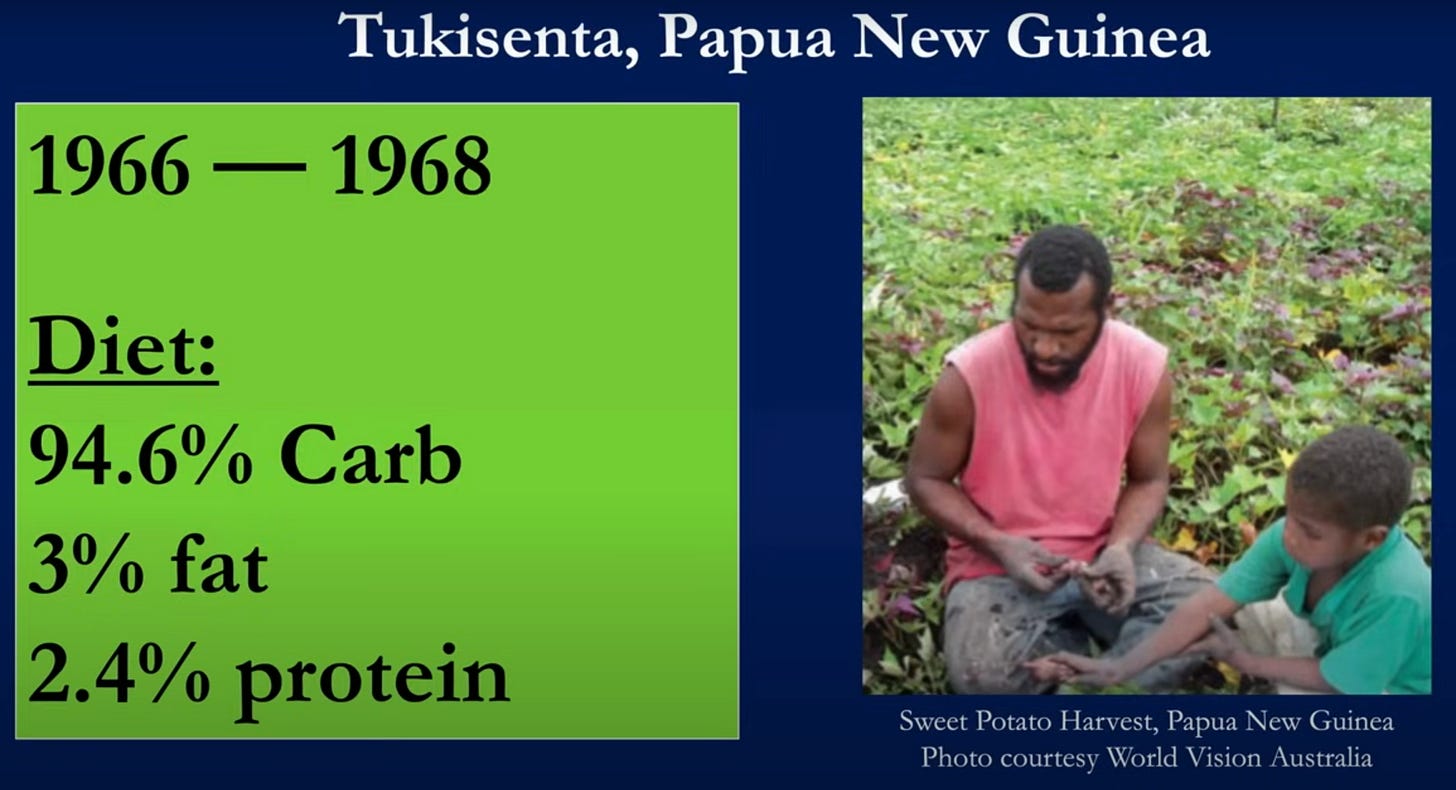
In both populations, obesity, diabetes, and various other chronic illnesses are rare. It’s clearly possible to maintain good metabolic health on diets with radically different macronutrient profiles, ranging from high-fat + high-protein to ultra-high carb. Contrast both of those with the macronutrient profile of the standard American diet, roughly 50% carb, 35% fat, 15% protein. This can be considered a high carb and high fat diet. As we’ll see later, consuming a diet high in both fats and carbs is likely a key factor for weight gain and metabolic dysfunction.
We’re all different, but we’re all the same
Why is it so hard to find traditional cultures with significant levels of metabolic dysfunction and chronic disease? Given the shear diversity of natural environments humans have occupied throughout history, wouldn’t we expect, just by chance, that some of those would contain a mix of natural foods that drive high levels of chronic disease?
Nature may provide a great diversity of edible plants and animals, but nature does not provide arbitrary diversity. In all natural ecosystems, there are biological constraints on the pattern of macronutrients found within living things. Whale blubber never has the sugar content of honey—there’s simply no food in Arctic with the carb content of the Hadza’s sugar-rich staple. If there was, the Inuit would have eaten it. If it became a regular addition to their high-animal fat diet, their metabolic health would likely deteriorate.
Humans eat what’s available, according to their tastes. The Inuit, Hadza, and native Papa New Guineans don’t have low rates of metabolic dysfunction because they’re counting calories and doing CrossFit. Their native environments simply don’t allow chronic metabolic dysfunction to develop. Take any historical hunter-gatherer and place them in our food environment and they will continue doing what all people have always done: eat what’s available, according to taste. Exactly what we’re doing.
So what are the essential differences between our food environment and those of all historical hunter-gatherers? To understand this, we have to examine how the macronutrient composition of the human diet has changed over time. We also have to break things down at the level of macronutrient subtypes, such as different types of fats. We’ll pay extra attention to what happened in the 20th century, well into the industrial age—the dietary shifts leading up to the rise in metabolic dysfunction that began by the 1960s and started accelerating by 1980.
The human dietary fat profile has changed dramatically over time
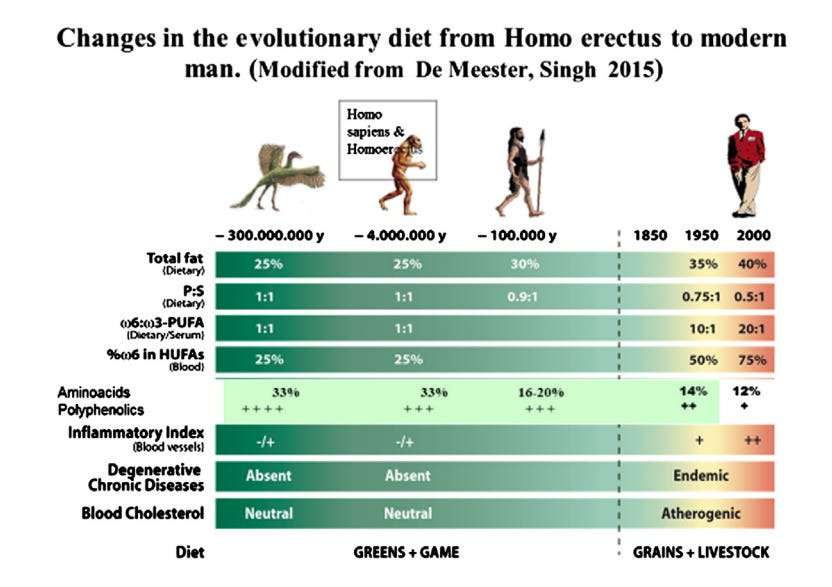
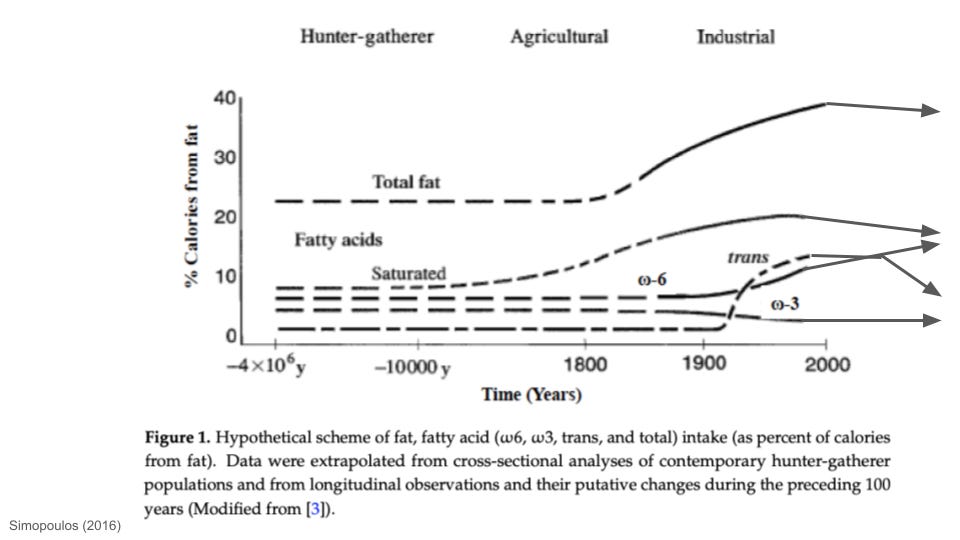
Here’s a chart I modified from this excellent paper, showing approximate changes in the percentage of our calories coming from fat, together with those coming from specific fatty acids, across most of human history:
Notice the broad trends, but remember: the obesity epidemic did not start accelerating until almost 1980 and has continued to the present.
Total calories from fat went up significantly over time, before peaking and starting to decline around 2000. Calories from saturated fat mirror this;
Trans fats were virtually non-existent before industrialization. Intake spiked then rapidly declined in the 1900s;
Omega-6 (ω-6) polyunsaturated fat consumption increased steadily post-industrialization. Omega-3 (ω-3) fat consumption dropped to its lowest levels ever.
While striking, the slow rise in total and saturated fat consumption started long before the epidemic in obesity and metabolic dysfunction took off. Moreover, rates of metabolic dysfunction have continued to climb despite more recent drops in total and saturated fat intake. If increases in total fat or saturated fat intake were sufficient to drive widespread metabolic dysfunction, we would have seen these things rising in the 1800s and falling after 2000. These things may be a factor, but there must be more to it than that.
The post-industrial spike in trans fat intake is also striking—but again, metabolic dysfunction continued climbing after trans fat consumption was curbed by regulations. Everyone agrees that trans fats are to be avoided, and people are mostly doing that. Did any patterns of fat consumption trend in only one direction over time?
There is one such pattern, which started a generation or two before obesity rates began to climb: the ω-6:ω-3 ratio. Omega-6 intake began rising in the 1900s while omega-3 intake declined. This trend has been quite steady since it began, leading to a much higher ω-6:ω-3 ratio today than any time in human history.
Recall the hunter-gatherer groups discussed above, who ate foods with dramatically different macronutrient profiles. One thing they all have in common: none consumed omega-6 fats at nearly the rate modern Westerners do.
Let’s dissect patterns of dietary fat intake in the US in more detail. How has the balance of saturated and monounsaturated fats changed in parallel with changes in omega-6 and omega-3 intake? What particular foods drove these changes?
After looking at trends in dietary fat intake more closely, we will construct a simple sketch of American’s dietary fat profile before and after the epidemic of metabolic dysfunction took off. From there, we will consider the metabolic and health consequences of distinct dietary fat profiles.
Dietary Fat: Trends in Animal- vs. Plant-Based Added Fats
This is a wonderful paper, documenting dietary trends in the US since the 1800s. By compiling together historical data from the federal government and other sources, they charted out changes in the food supply (a proxy for consumption) over time. (I spoke to Dr. Orrin Devinsky about this paper and its implications on M&M #135).
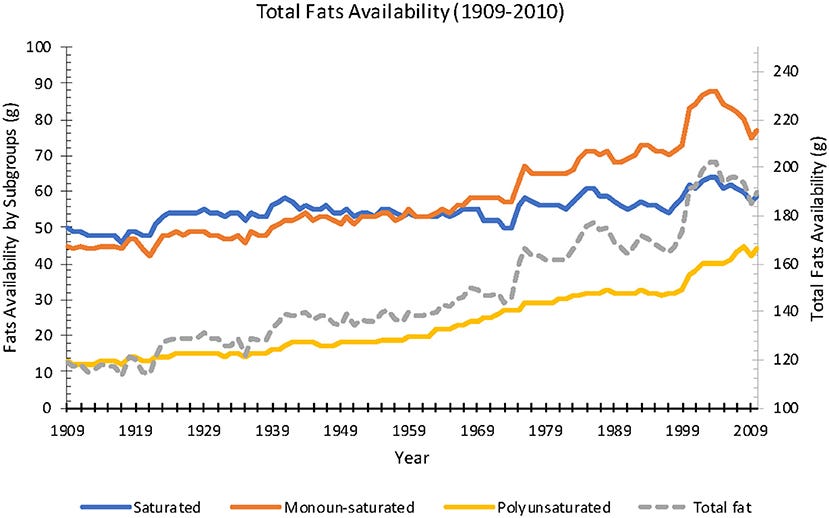
Let’s dissect the trends for dietary fats starting with this graph, which we looked at before:
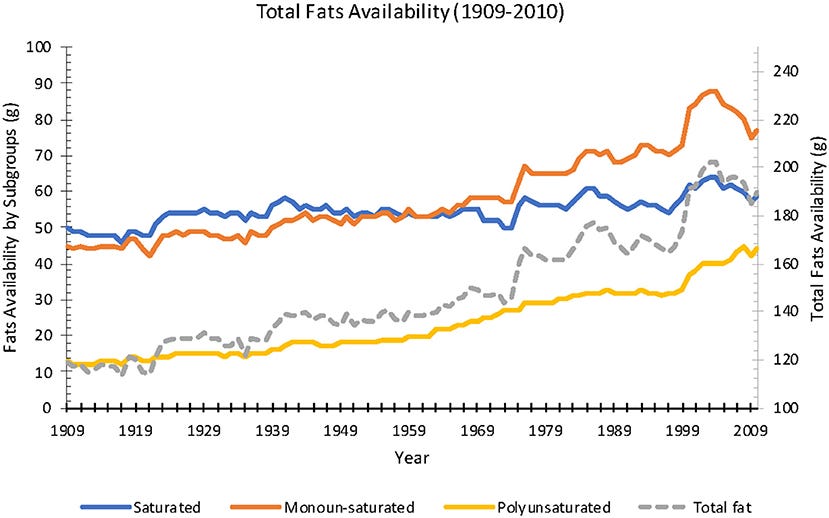
Total fat availability increased quite steadily from 1909-2010;
Unsaturated fat availability rose more quickly than saturated fat availability;
For all fat types, the long-term trend of increased availability accelerated ~1999.
The late spike in saturated and monounsaturated fat supply peaked in the early 2000s, then declined;
Polyunsaturated fat did not peak and decline in the 2000s—it continued rising;
The ratio of dietary fats was very different in 2010 vs. 1909. Saturated fat availability declined over time relative to mono- and especially polyunsaturated fat.
Compared to Americans in the early 1900s, those living in the early 2000s were consuming not just more total fat, but a different profile of fatty acids. Roughly speaking, saturated fat went from about one-half of dietary fat in 1909 to one-third in 2010.
This shift in our dietary fat profile was largely driven by shifts away from animal-based fats and towards plant-based fats. As a rule of thumb (with exceptions), animal-based fats tend to have higher saturated fat content; plant-based fats tend to have higher polyunsaturated fat content. (We will dissect the specific fat content of different animal- and plant-based foods below).
Here is the change in supply over time for added fats and oils—things we add to or cook food in, like butter or vegetable oil:
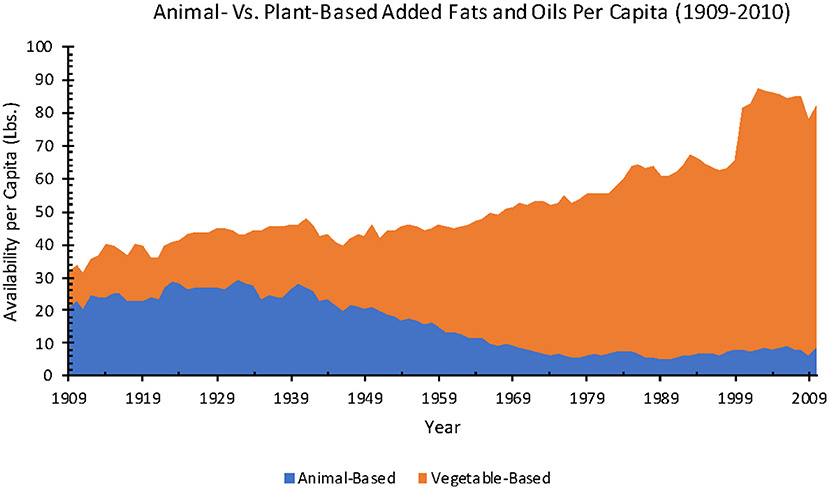
Animal-based added fats accounted for the majority of added fats in the early 1900s. By the end of WWII this was no longer true, becoming increasingly skewed in the opposite direction thereafter;
Animal fat supply reached a minimum in the 1970s, where it has stayed;
Plant-based fats rose almost linearly throughout the 1900s, before spiking and plateauing in the first part of the 2000s.
“Animal fats” refers to things like butter, lard, and beef tallow; “plant fats” to things like margarine, shortening, and vegetable oils. Here’s how the supply of each changed over time:
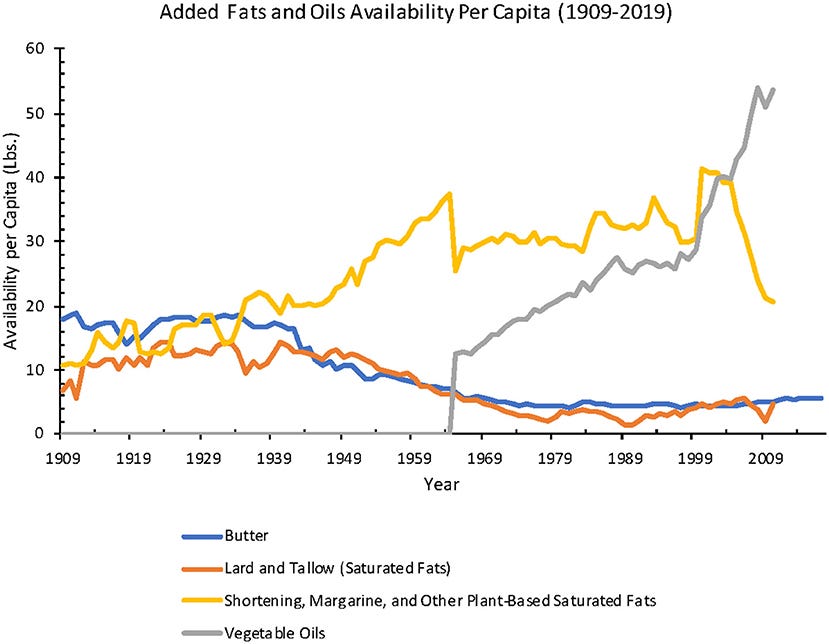
Data for vegetable oils were not available for the early 1900s, but you can see the trajectory it was on by the mid-1960s. Animal-based fats began dropping off by about 1940 while plant-based fats began ascending. Notice that vegetable oil availability was clearly rising from 1960 to 1999, before accelerating further around 2000.
The general trend in added fat consumption has been a transition away from animal and towards plant fats. This came along with an increase in total fat intake (which peaked by 2000) and a significant shift in the balance of different dietary fats. In relative terms, people’s dietary fat intake today is much lower in saturated fat and higher in unsaturated fat (especially polyunsaturated fat) than it was in the early 1900s.
Now we need to dissect things down to the level of specific types of saturated and unsaturated fatty acids, such as omega-3s vs. omega-6s. We’ll do this for animal- and plant-based fats separately, as the fat content of each has changed over time.
Let’s start with a dissection of fat content of dietary vegetable oils, as these have displayed some of the most dramatic changes in consumption over time.
This article draws on information from these podcast episodes:
M&M #135: History of Diet Trends & Medical Advice in the US, Fat & Cholesterol, Seed Oils, Processed Food, Ketogenic Diet, Can We Trust Public Health Institutions? | Orrin Devinsky
M&M #134: Omega-6-9 Fats, Vegetable & Seed Oils, Sucrose, Processed Food, Metabolic Health & Dietary Origins of Chronic Inflammatory Disease | Artemis Simopoulos
M&M #132: Obesity Epidemic, Diet, Metabolism, Saturated Fat vs. PUFAs, Energy Expenditure, Weight Gain & Feeding Behavior | John Speakman
Dietary Fat: Dissecting Seed Oils
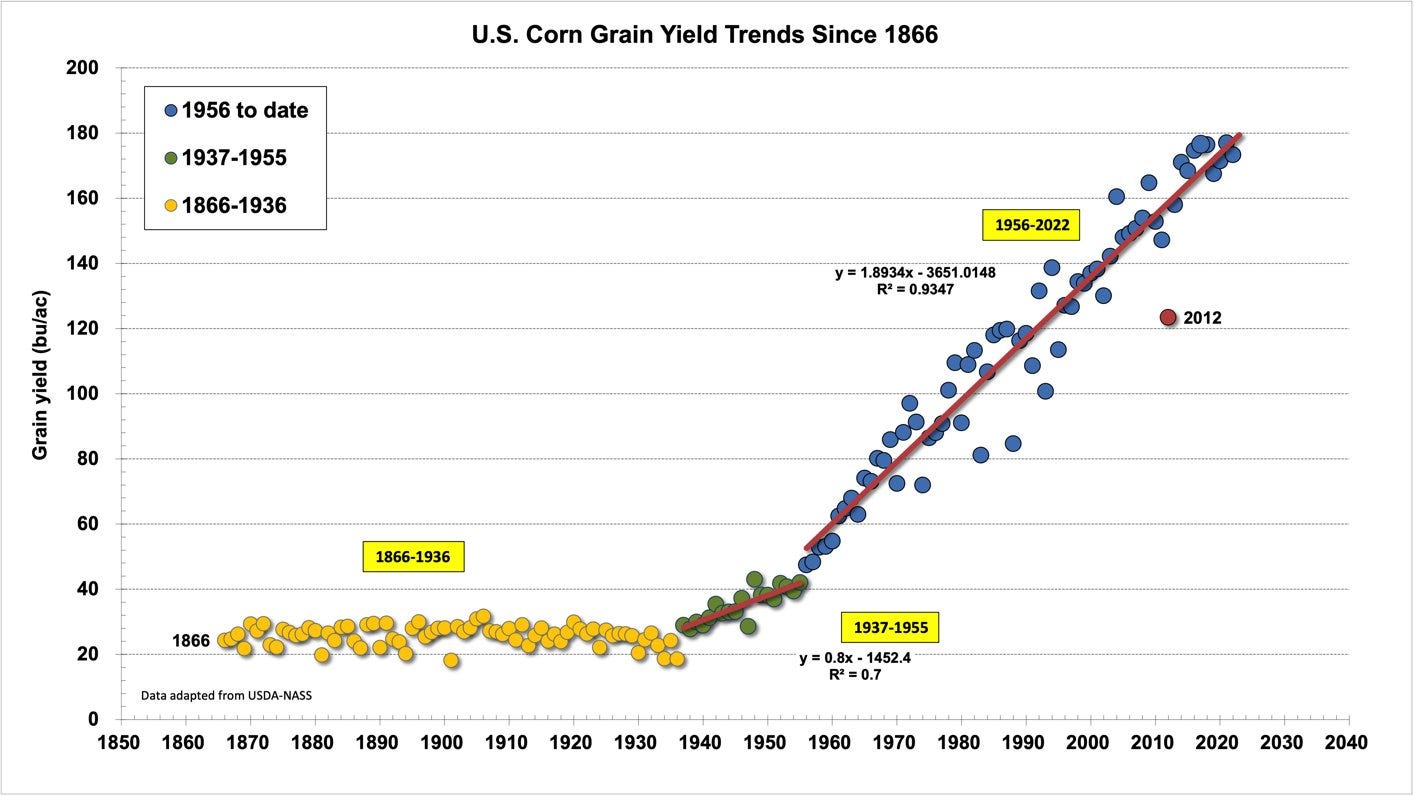
There was a clear transition away from added animal fats and towards plants fats starting in the 1940s. A significant driver of this was an increase in the seed oil supply. But why did the seed oil supply increase? From WWII on, we got better and better at agriculture. By the mid-1950s, grain yields really took off:
The dramatic increase in supply naturally led to lower grain prices. This facilitated two things, each of which influenced the distribution of dietary fats in our food supply:
It became more cost-effective to produce grain-based food products. Mass-production of consumer goods, offered at cheaper and cheaper prices, helped drive consumer adoption of “seed oils” and new processed foods. (I will use “vegetable oil” and “seed oil” interchangeably);
Cheap grains were used as animal feed, enabling us to farm animals more efficiently. Grain-fed meat became more and more common, at the expense of grass-fed meat (more on that in the next section).
These trends show no clear sign of stopping or reversing. Here is a projection of the market for seed oils going to 2026:
As we will see, terms like “vegetable oil” and “seed oil” are fairly vague—two different vegetable oils may or may not have similar fatty acid profiles. Let’s have a look at the most widely consumed individual vegetable oils and then examine their specific fat content. We want to think about them in terms of their fatty acid profile.
The Fatty Acid Content of Common Seed Oils
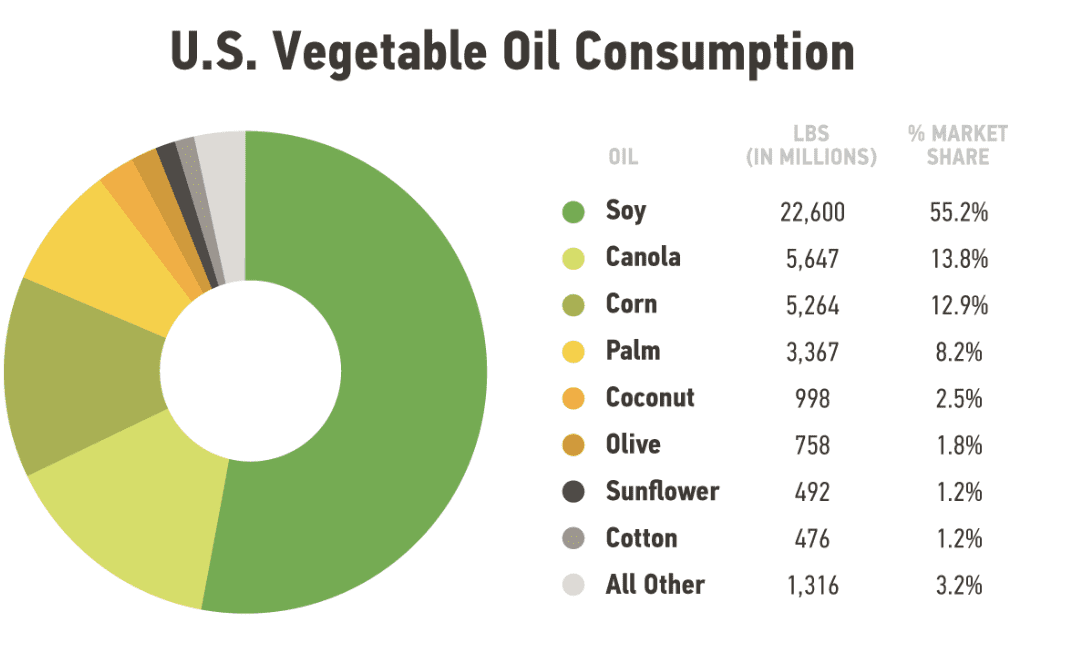
At >50% market share, soybean oil is the most widely consumed vegetable oil;
Soy, canola, and corn oil account for >80% of U.S. vegetable oil consumption.
While all the above are “vegetable oils,” that does not mean they have similar fatty acid profiles. Here’s a chart showing the relative abundance of saturated, monounsaturated, omega-6 and omega-3 polyunsaturated fatty acids across common vegetable oils (a few animal-based fats are also included for comparison):
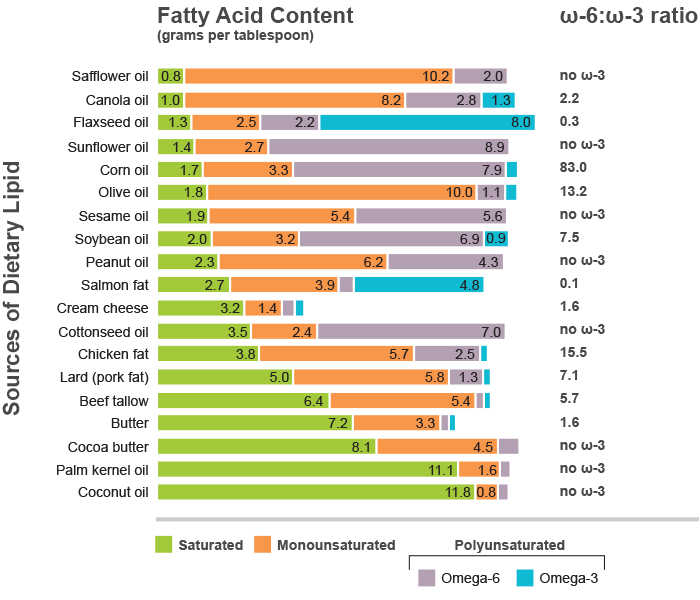
Pay attention to both the ω-6:ω-3 ratio and the absolute fatty acid levels. For example, chicken fat has a ω-6:ω-3 ratio about twice as big as soybean oil, but soybean oil contains 6.9 grams per serving of ω-6 PUFAs while chicken fat contains 2.5 grams.
Notice the general patterns:
Animal-based fats derived from chicken, pork, and beef contain mainly saturated and monounsaturated fatty acids (MUFAs), with little PUFAs;
Most vegetable oils contain a majority of unsaturated fats, with the mix of MUFAs and PUFAs varying between them;
Coconut oil, palm kernel, and cocoa butter stand out among vegetable oils, with high levels of saturated fat and almost no PUFAs;
Olive oil, made from the fruit rather than the seeds of olives, has largely MUFAs, with much lower levels of SFAs and PUFAs;
Omega-3 PUFAs are present at very low levels in most oils of all kinds, flaxseed oil being the exception;
The omega-6 PUFA linoleic acid is abundant in a number of vegetable oils, including the some of the most widely consumed (soy, canola, corn).
Recall what we noted earlier about trends in US dietary fat intake: an increase in the ω-6:ω-3 ratio was the only major pattern that clearly moved in only one direction over time. Now we’ve begun to see why.
Increases in grain production efficiency helped drive up the supply and consumption of vegetable-based added fats and oils. These are often high in polyunsaturated fats, including omega-6 PUFAs;
Almost all vegetable and other cooking oils have an ω-6:ω-3 ratio > 1, with most of them significantly above this. The ω-6:ω-3 ratio for soybean oil, the most widely consumed vegetable oil, is more than 7:1;
Vegetable oils are highly concentrated. They often contain higher absolute levels of omega-6 PUFAs, even compared to whole foods with an ω-6:ω-3 ratio > 1.

The transition away from animal and towards plant fats that we’ve been exploring applies to added fats, like cooking oils. It does not apply to total fat intake. We may be consuming more vegetable oils than ever before, but Americans are still consuming more total fat than we did for most of human history. This includes fat consumed from animal meat (and we eat plenty of it).
How have patterns of meat consumption changed over time? What about the fat profile of the meats we consume?
Dietary Fat: Dissecting Animal Fat
When we think of eating animal meat, we generally think of protein first. Animal meat does indeed have high protein content. It also contains fat—sometimes just a little, sometimes quite a bit. Let’s look at trends in red meat, poultry, and seafood consumption. We also need to consider how the fat profiles of each compare and how these have shifted over time in response to changes in how we raise farm animals.
For simplicity, we will default to considering beef the stand-in for red meat, chicken for poultry, and fatty fish (salmon, tuna) for seafood. Key things to remember as we moved forward:
Protein consumption as remained quite flat over time, in contrast to the increases in total fat and carb intake seen in the second half of the 1900s;
Overall fat consumption profiles have changed drastically. Today, we consume relatively less saturated fat and more unsaturated fat, especially polyunsaturated fat;
Among the polyunsaturated fats we consume, intake of omega-6 is higher and intake of omega-3 is lower than ever before. ω-6:ω-3 ratios are often 20:1 or higher today, compared to roughly 1:1 for most of human evolution.
With those things in mind, let’s look at changes in the animal meat supply over time. We’ll then consider how the fat profiles of beef, chicken, and salmon compare, as well as how the fat profiles of each have changed.
Supply & Consumption of Red Meat, Poultry & Fish Over Time
Red meat supply has been mostly declining since 1970, over the period in which obesity and diabetes rates began accelerating;
Poultry supply has been rising quite steadily since about 1940;
Seafood supply has been flat over time;
In relative terms, people in the early 1900s were eating much more red meat than poultry and seafood; today, we eat much more red meat and poultry than seafood.
Here’s another chart, showing the change in consumption of chicken, fish, pork, and beef in the U.S. from 1965 onward:
Chicken consumption rose a lot—the most dramatic shift here. Fish consumption rose more modestly, while pork and beef consumption dropped off somewhat. This means that the overall macronutrient profile has become more skewed towards the chicken profile over time. How does the fat profile of different meats compare?
Comparing Fat Profiles Across Animal Meats
Comparing fat profiles across meats gets tricky—different species, different cuts of meat. Chuck steak and sirloin don’t have the same nutrient profile; chicken breasts and drumsticks differ; and so on. Furthermore, the way that animals are raised matters: what your food eats determines the nutrient profile it will have.
As a general rule, it has become more common over time for our meat to come from animals raised under artificial rather than natural conditions. By “natural” and “artificial,” I mean whether animals are free to move and have access to foods similar to what their wild ancestors ate.
Ruminant mammals like cows evolved to eat grasses. They can be fed grains, but their wild ancestors ate grass. Because they have an extended evolutionary history with one food but not the other, their bodies process them differently. Cows fed grass will have a different macronutrient profile than those fed grains. Same idea for pasture-raised vs. factory-farmed chickens, wild-caught vs. farmed fish, and human hunter-gatherers vs. modern sedentary people.
We don’t want to get lost in a sea of numbers and comparisons—just a basic sense of how the fat profile of different meats compare. We also want a sense for the general direction the fat profile of meats have drifted over time as more and more has come from animals fed artificial, grain-based diets.
Roughly speaking, here’s how the fat content of beef, chicken, and salmon compare, together with the direction artificial conditions tend to shift their fat profile:
Beef fat: SFAa and MUFAs at roughly comparable levels, much higher than PUFA content. Compared to pasture-raised grass-fed cows, the beef from grain-fed cows has higher total fat and MUFA content, and PUFAs with a higher ω-6:ω-3 ratio.
Chicken fat: Roughly comparable levels of SFA, MUFAs, and PUFAs. Compared to pasture-raised chickens eating an omnivorous diet (seeds, insects, worms), grain-fed chickens tend have higher levels of total fat, SFAs, and MUFAs, and PUFAs with a higher ω-6:ω-3 ratio.
Salmon fat: Roughly comparable levels of SFA, MUFAs, and PUFAs, often with more MUFAs than SFAs and PUFAs. Salmon PUFAs contain high omega-3 levels, typically with a ω-6:ω-3 << 1. Compared to wild-caught salmon, farmed salmon tends to have more total fat and SFAs, and much higher omega-6 levels.
In general, animals raised under artificial conditions produce meat with higher total fat content than those raised under more natural conditions. Artificial conditions also shift fat profiles, resulting in a higher ω-6:ω-3 ratio.
Some data showing how artificial diets affect omega-3 levels in beef:
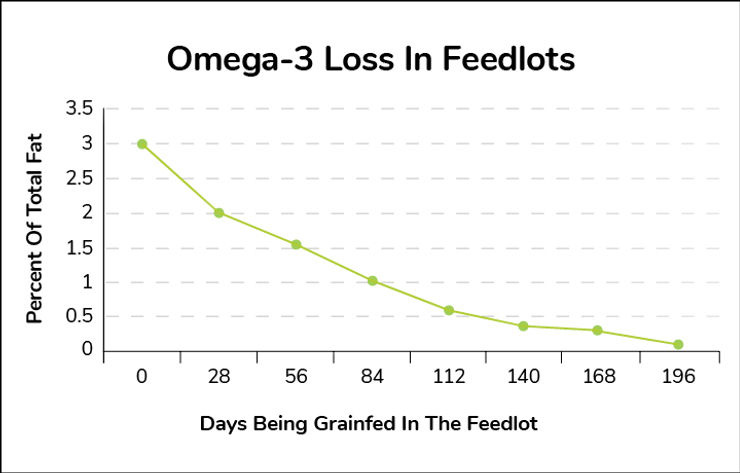
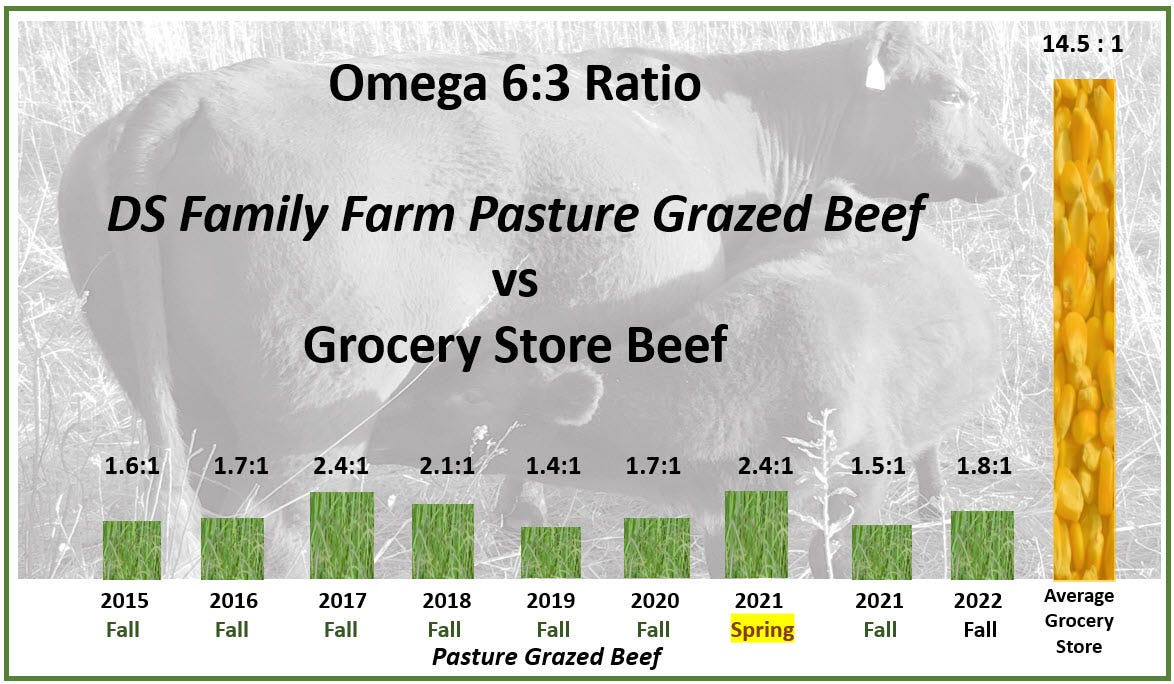
The same idea generally holds for other meats. Animals fed natural diets have lower total fat content and a lower ω-6:ω-3 ratio; those fed artificial, grain-based diets have higher total fat content and a higher ω-6:ω-3.
Some example data for three types of fish:
Our Meat Supply Has a Higher ω-6:ω-3 Ratio Than Ever
One of the most striking changes in meat consumption is the dramatic rise of poultry we saw above. In 2010, both red meat and fish were being consumed at roughly the same levels as they were in the early 1900s. In contrast, poultry supply increased roughly five-fold, surpassing beef as the most widely consumed meat in the U.S. by 2010.
Similar to our study of vegetable oils, we have to consider both the relative ratio of fatty acids and their absolute levels. Here’s some data comparing absolute levels of omega-6 and omega-3 across various meats, together with ω-6:ω-3 ratios:
Chicken has become the most consumed meat in the US, it’s fat has one of the highest ω-6:ω-3 ratios among animal meats, and it supplies high absolute levels of omega-6 PUFAs. In a sense, chicken is to animal meat as soybean oil is to seed oils—both are the most widely consumed food in their category and contain much more omega-6 fat than most similar foods.
We can be confident that the proportion of meat coming from grain-fed animals has increased since the early 1900s, as farming practices have grown in scale and production efficiency. I can’t find exact numbers for this going back in time, but over 80% of beef in the US today comes grain-fed cattle. Given the general trends in animal husbandry and human meat consumption—more grain-fed animals, increased chicken consumption—we can be reasonably confident that, over time, we’ve been consuming meat with a higher total fat content and higher ω-6:ω-3 ratio.
Overall Fat Consumption Trends Revisited
We now have basic explanation for why total fat consumption rose so much from the early 1900s to 2000, and why the balance of fatty acids consumed shifted toward unsaturated and away from saturated fats:
Advancements in agriculture drove grain production to an unprecedented scale;
An abundance of cheaper and cheaper grains drove changes in both the plant- and animal-based food supply:
Greater consumption of plant-based processed foods like vegetable oils;
A shift in the fat profile of animal meat, driven by the use of cheap grains as animal feed.
Both trends facilitated the consumption of more total fat, with a higher proportion of unsaturated fat and a much higher ω-6:ω-3 ratio.
The ω-6:ω-3 ratio in both plant- and animal-based fats has increased over time, but exactly how much omega-6 fatty acid consumption are we talking about? Here’s a graph showing the percentage of calories coming from linoleic acid, the most common dietary omega-6 PUFA:

After the year 2000, the percentage of our calories coming from linoleic acid jumped to over 10%. In other words, that represents more than one in every ten calories coming from a single omega-6 PUFA.
Recall some our earlier observations: total carb, total fat, and total caloric intake all began dropping off around 1999-2000 after many years of rising. The same was true for saturated and monounsaturated fat. In contrast, obesity and diabetes rates continued to climb after 2000.
PUFAs were the one dietary fat subtype that continued climbing through 2000. Indeed, we can see that the PUFA intake trend actually accelerated at this time, driven largely by increased linoleic acid consumption.
Not only have we been consuming more linoleic acid over time, our fat tissue contains more of it. Measurements taken from biopsies of human adipose tissue indicate that the linoleic acid content of our body fat has doubled since the 1950s:

And there’s a clear correlation between linoleic acid intake and the linoleic acid content of fat tissue:

While interesting, these observations don’t prove that increased PUFA consumption or a high ω-6:ω-3 ratio drive metabolic disease. Trends and correlations are intriguing, but they don’t prove cause-and-effect.
To understand whether elevated ω-6:ω-3 ratios can actually cause things like weight gain, metabolic dysfunction, and chronic disease, we need to do two things:
Understand the biology of fatty acid metabolism. For example, what are the biological consequences of metabolizing omega-6 vs. omega-3 PUFAs?
Look to the preclinical (animal) and clinical (human) literature to see if diets with specific fat profiles can actually cause weight gain, metabolic dysfunction, or chronic disease.
To learn more about the topics covered in this essay, try these episodes of the Mind & Matter podcast:
M&M #135: History of Diet Trends & Medical Advice in the US, Fat & Cholesterol, Seed Oils, Processed Food, Ketogenic Diet, Can We Trust Public Health Institutions? | Orrin Devinsky
M&M #134: Omega-6-9 Fats, Vegetable & Seed Oils, Sucrose, Processed Food, Metabolic Health & Dietary Origins of Chronic Inflammatory Disease | Artemis Simopoulos
M&M #132: Obesity Epidemic, Diet, Metabolism, Saturated Fat vs. PUFAs, Energy Expenditure, Weight Gain & Feeding Behavior | John Speakman
Related content:




> It’s possible to maintain good metabolic health on a high fat-low carb diet, or a low carb-high fat diet.
You said the same thing twice. You likely meant "high fat-low carb or low fat-high carb diet."
> Omega-3 PUFAs are present at very low levels in most oils of all kinds, flaxseed oil being the exception;
Do you mean sunflower/safflower oil? Flaxseed has a lot of omega-3.